
Big Bear Market Stats as of October 1st, 2020

Big Bear Market Stats as of October 1, 2020
- Total Active Residential Properties: 148 (2% increase from September)
October 2019 reported 577 - Total Residential Properties in Back-Up and Pending: 309 (17% decrease from September)
- Total Residential Properties Sold in September: 266 (14% increase from August)
112 properties sold in September 2019, and 119 sold in September 2018. - 233 Sold in August
199 Sold in July
133 Sold in June
51 Sold in May
45 Sold in April
101 Sold in March - New Residential Listings in September: 218 (13% decrease from 250 in August)
- 7% of Current Market has been reduced in price in September.
- *Properties sold from January 1st 2020 to September 30th 2020: 1218 (33% increase from 916 from January to September 2019)
- *Total Sales Volume January 1st 2020 to September 30th 2020: $528,812,201 (66% increase from $318,802,001 from January to September 2019)
Price breakdown as of October 1, 2020
$0-300,000K – 33 units – 23% of inventory
$300,001-500k – 39 units – 26% of inventory
$500,001-800k – 21 units – 14% of inventory
$800,001k plus – 55 units – 37% of inventory
Sold January-September 2020 – 1218 units
$0-300,000k – 506 units – 42% of sold units
$300,001-500k – 428 units – 35% of sold units
$500,001-800k – 188 units – 15% of sold units
$800,001 plus – 96 units – 8% of sold units
Share this:

Big Bear Market Statistics as of August 1st, 2020

Big Bear Market Stats as of August 1, 2020
- Total Active Residential Properties: 195 (35 % decrease from July)
July 2019 reported 572 - Total Residential Properties in Back-Up and Pending: 317 (15% increase from July )
- Total Residential Properties Sold in July 199 (49 % increase from June)
106 properties sold in July 2019, and 99 sold in July 2018. - 133 Sold in June
51 Sold in May
45 Sold in April
101 Sold in March
85 Sold in February
80 Sold in January - New Residential Listings in July: 178 (1% increase from 176 in June)
- 13 % of Current Market has been reduced in price in July.
- Properties sold from January 1st 2020 to July 31th 2020: 707 (6 % increase from 670 from January to June 2019)
- Total Sales Volume January 1st 2020 to July 30th 2020: $280,452,905 (20% increase from $232,088,183 from January to July 2019)
Price breakdown as of August 1, 2020
$0-300,000K – 52 units – 27 % of inventory
$300,001-500k – 50 units – 25 % of inventory
$500,001-800k – 23 units – 12 % of inventory
$800,001k plus – 70 units – 36 % of inventory
Sold January-July 2020 – 707 units
$0-300,000k – 335 units – 47 % of sold units
$300,001-500k – 238 units – 34 % of sold units
$500,001-800k – 92 units – 13 % of sold units
$800,001 plus – 42 units – 6 % of sold units
Share this:

Big Bear Market Stats as of August 1, 2020
Big Bear Market Stats as of August 1, 2020
- Total Active Residential Properties: 195 (35 % decrease from July)
July 2019 reported 572 - Total Residential Properties in Back-Up and Pending: 317 (15% increase from July )
- Total Residential Properties Sold in July 199 (49 % increase from June)
106 properties sold in July 2019, and 99 sold in July 2018. - 133 Sold in June
51 Sold in May
45 Sold in April
101 Sold in March
85 Sold in February
80 Sold in January - New Residential Listings in July: 178 (1% increase from 176 in June)
- 13 % of Current Market has been reduced in price in July.
- Properties sold from January 1st 2020 to July 31th 2020: 707 (6 % increase from 670 from January to June 2019)
- Total Sales Volume January 1st 2020 to July 30th 2020: $280,452,905 (20% increase from $232,088,183 from January to July 2019)
Price breakdown as of July 1, 2020
$0-300,000K – 52 units – 27 % of inventory
$300,001-500k – 50 units – 25 % of inventory
$500,001-800k – 23 units – 12 % of inventory
$800,001k plus – 70 units – 36 % of inventory
Sold January-July 2020 – 707 units
$0-300,000k – 335 units – 47 % of sold units
$300,001-500k – 238 units – 34 % of sold units
$500,001-800k – 92 units – 13 % of sold units
$800,001 plus – 42 units – 6 % of sold units
Share this:

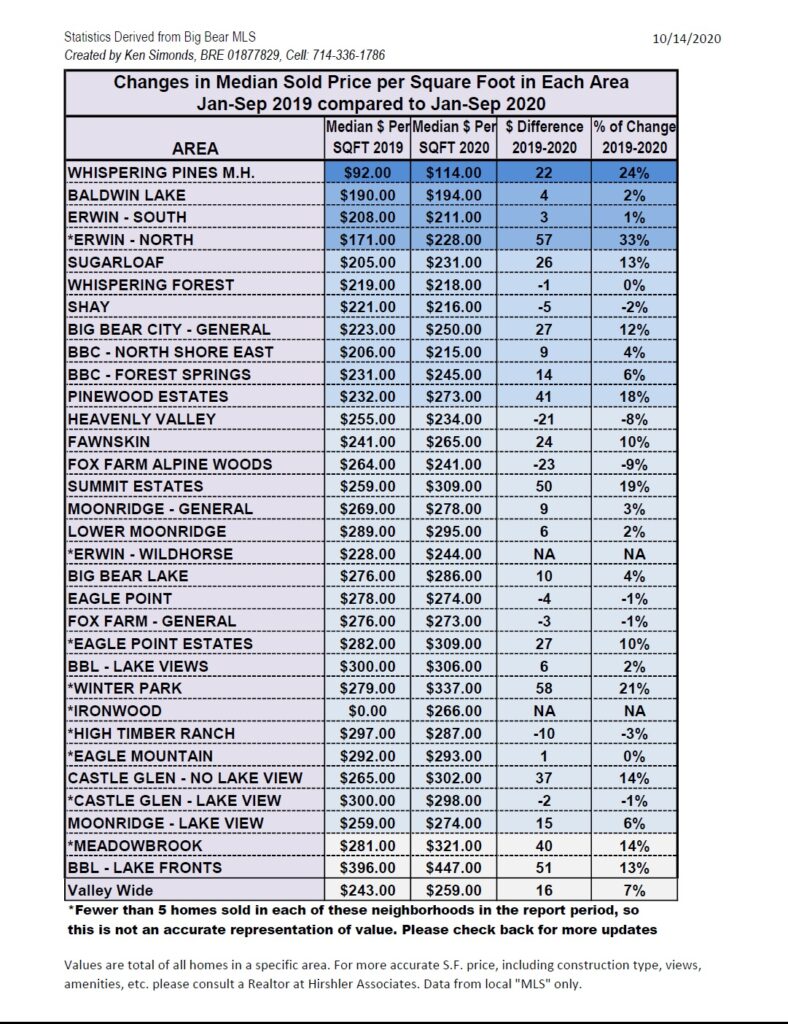
Median Sold Price per Square Foot and Units Sold 2019 Compared to 2020

Big Bear Market Stats as of July 1st, 2020

Big Bear Market Stats as of July 1, 2020
- Total Active Residential Properties: 298 (21% decrease from June)
July 2019 reported 572 - Total Residential Properties in Back-Up and Pending: 274 (52% increase from June)
- Total Residential Properties Sold in June: 133 (160% increase from May)
100 properties sold in June 2019, and 102 sold in June 2018. - 51 Sold in May
45 Sold in April
101 Sold in March
85 Sold in February
80 Sold in January
124 Sold in December - New Residential Listings in June: 172 (2% increase from 169 in May)
- 13% of Current Market has been reduced in price in June.
- Properties sold from January 1st 2020 to June 30th 2020: 506 (10% decrease from 564 from January to June 2019)
- Total Sales Volume January 1st 2020 to June 30th 2020: $192,071,564 (3% decrease from $197,188,691 from January to June 2019)
Price breakdown as of July 1, 2020
$0-300,000K – 68 units – 22.9% of inventory
$300,001-500k – 86 units – 28.9% of inventory
$500,001-800k – 62 units – 20.9% of inventory
$800,001k plus – 82 units – 27.3% of inventory
Sold January-June 2020 – 506 units
$0-300,000k – 260 units – 51.4% of sold units
$300,001-500k – 165 units – 32.6% of sold units
$500,001-800k – 53 units – 10.5% of sold units
$800,001 plus – 28 units – 5.5% of sold units
Share this:

- « Previous Page
- 1
- …
- 16
- 17
- 18
- 19
- 20
- …
- 55
- Next Page »