Big Bear Market Stats as of February 1, 2021
- Total Active Residential Properties: 64 (15% decrease from January)
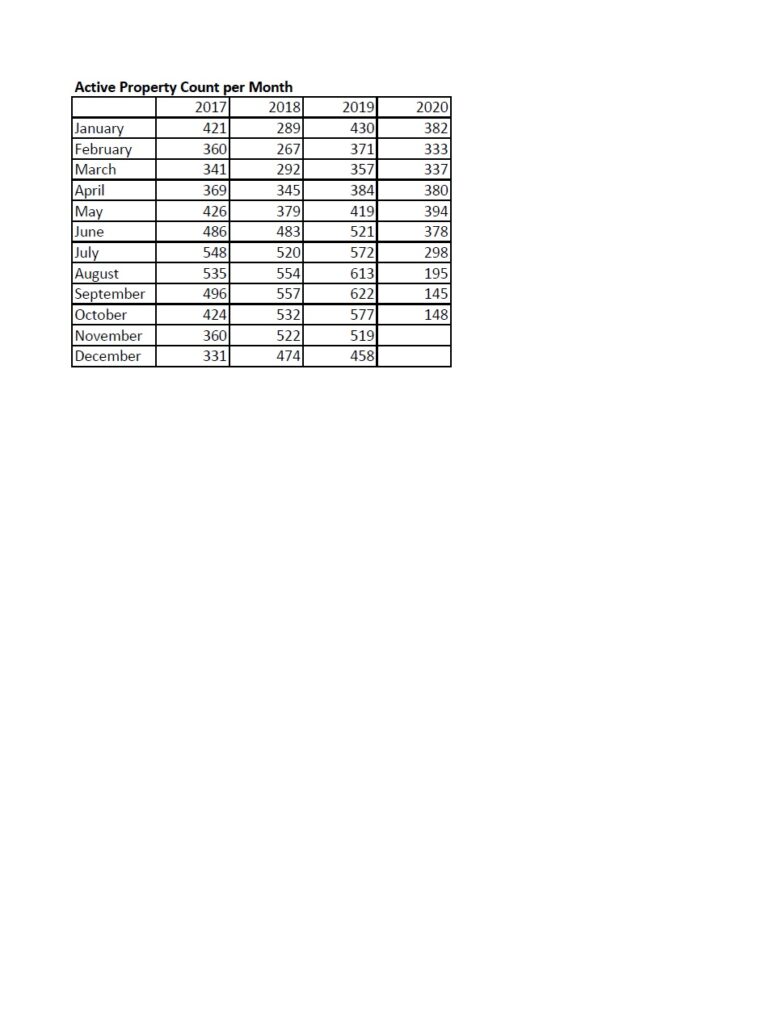
February 2020 reported 333 - Total Residential Properties in Back-Up and Pending: 158 (8% decrease from January)
- Total Residential Properties Sold in January: 133 (16% decrease from December)85 properties sold in January 2020, and 86 sold in January 2019.
- 158 Sold in December
204 Sold in November
202 Sold in October
266 Sold in September
233 Sold in August
199 Sold in July - New Residential Listings in January: 115 (14% increase from 101 in December)
- 3% of Current Market has been reduced in price in January.
- Properties sold from January 1st 2021 to January 31st 2021: 133 (57% increase from 85 in January 2020)
- Total Sales Volume January 1st 2021 to January 31st 2021: $59,546,498 (86% increase from $31,960,675 in January 2020)
Price breakdown as of February 1, 2021
$0-300,000K – 6 units – 9% of inventory
$300,001-500k – 19 units – 30% of inventory
$500,001-800k – 12 units – 19% of inventory
$800,001k plus – 27 units – 42% of inventory
Sold January 2021 – 133 units
$0-300,000k – 26 units – 38% of sold units
$300,001-500k – 76 units – 36% of sold units
$500,001-800k – 23 units – 16% of sold units
$800,001 plus – 8 units – 10% of sold units