Big Bear Market Stats as of July 4th, 2021
Price breakdown as of July 4, 2021
$0-300,000K – 25 units – 11% of inventory
$300,001-500k – 81 units – 36% of inventory
$500,001-800k – 80 units – 36% of inventory
$800,001k plus – 37 units – 17% of inventory
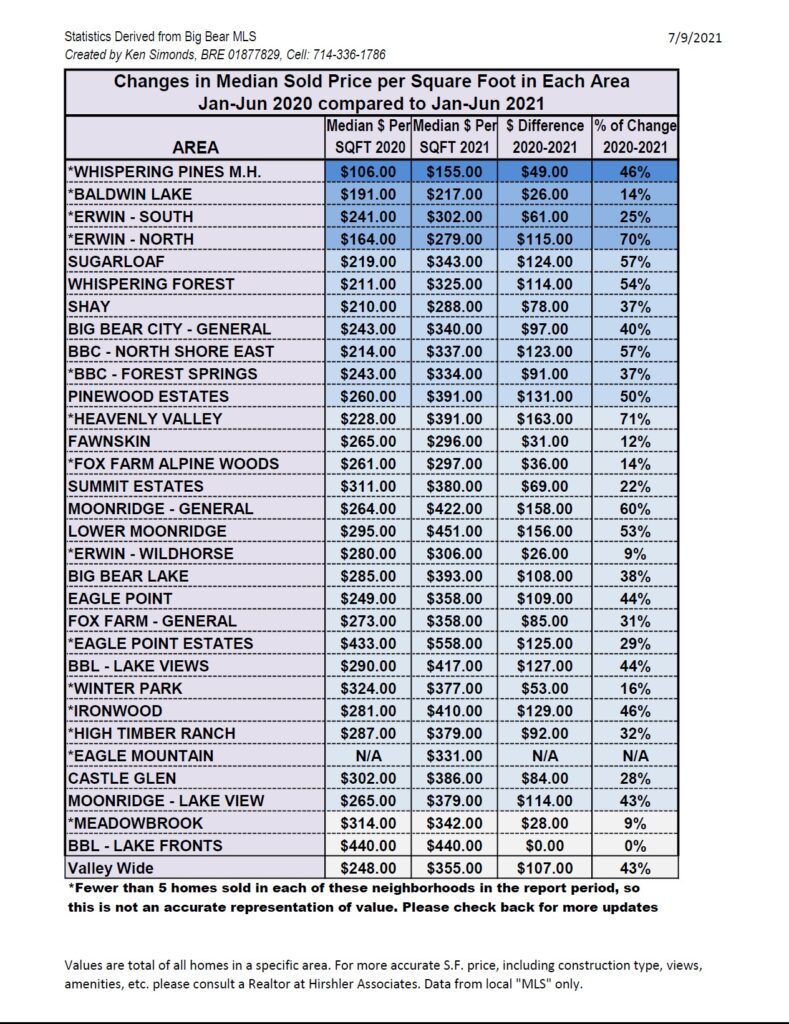
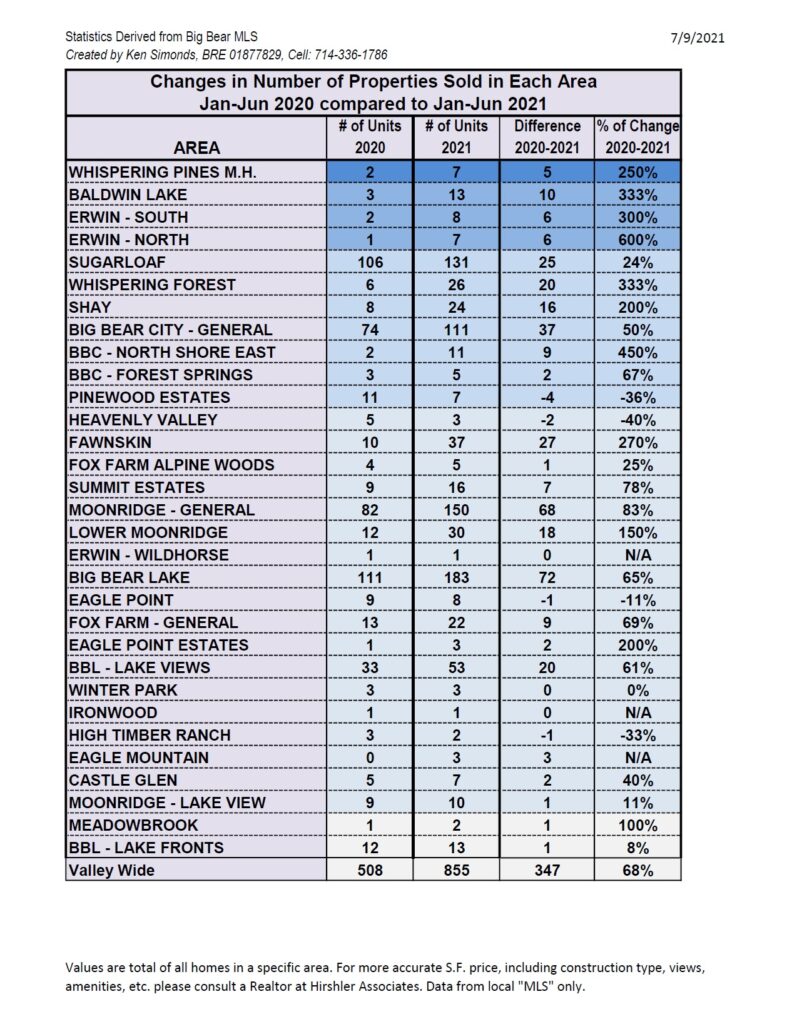
*Sold Jan-May 2021 – 855 units
$0-300,000k – 133 units – 16% of sold units
$300,001-500k – 385 units – 45% of sold units
$500,001-800k – 239 units – 28% of sold units
$800,001 plus – 98 units – 11% of sold units

Big Bear Market Stats as of May 4th, 2021
Price breakdown as of May 4, 2021
$0-300,000K – 18 units – 13% of inventory
$300,001-500k – 44 units – 38% of inventory
$500,001-800k – 46 units – 19% of inventory
$800,001k plus – 40 units – 30% of inventory
Sold Jan-Apr 2021 – 530 units
$0-300,000k – 86 units – 16% of sold units
$300,001-500k – 237 units – 45% of sold units
$500,001-800k – 141 units – 27% of sold units
$800,001 plus – 66 units – 12% of sold units
Big Bear Market Stats as of April 1, 2021
Price breakdown as of April 1, 2021
$0-300,000K – 15 units – 13% of inventory
$300,001-500k – 42 units – 38% of inventory
$500,001-800k – 21 units – 19% of inventory
$800,001k plus – 34 units – 30% of inventory
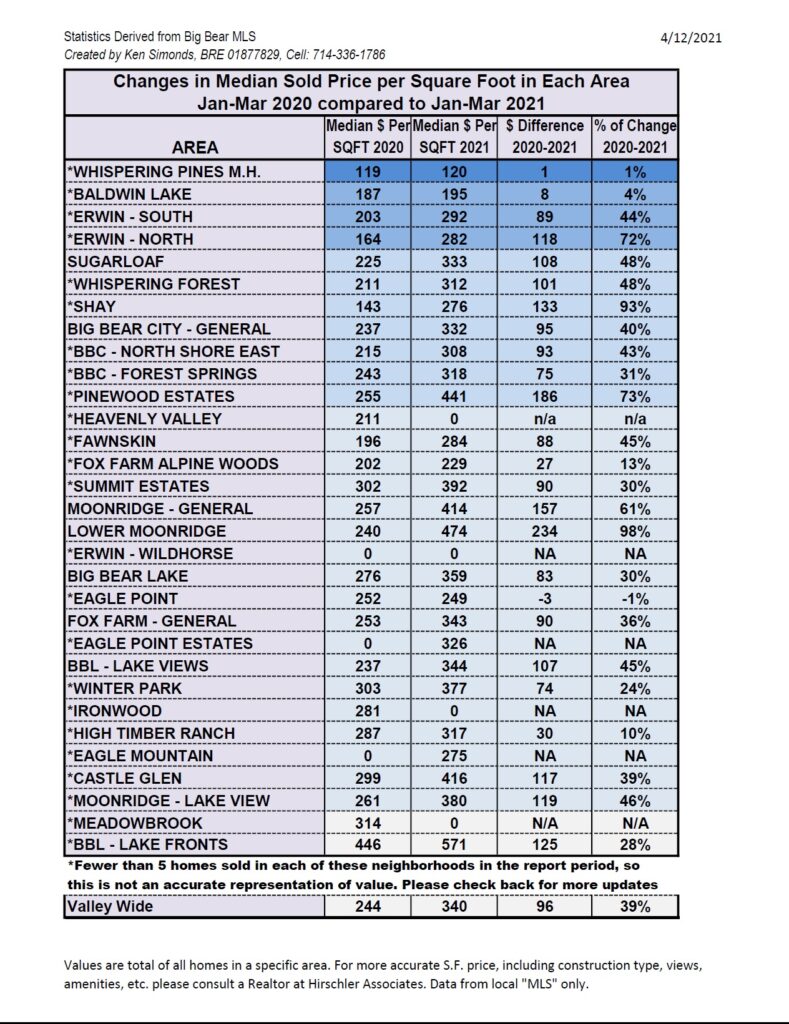
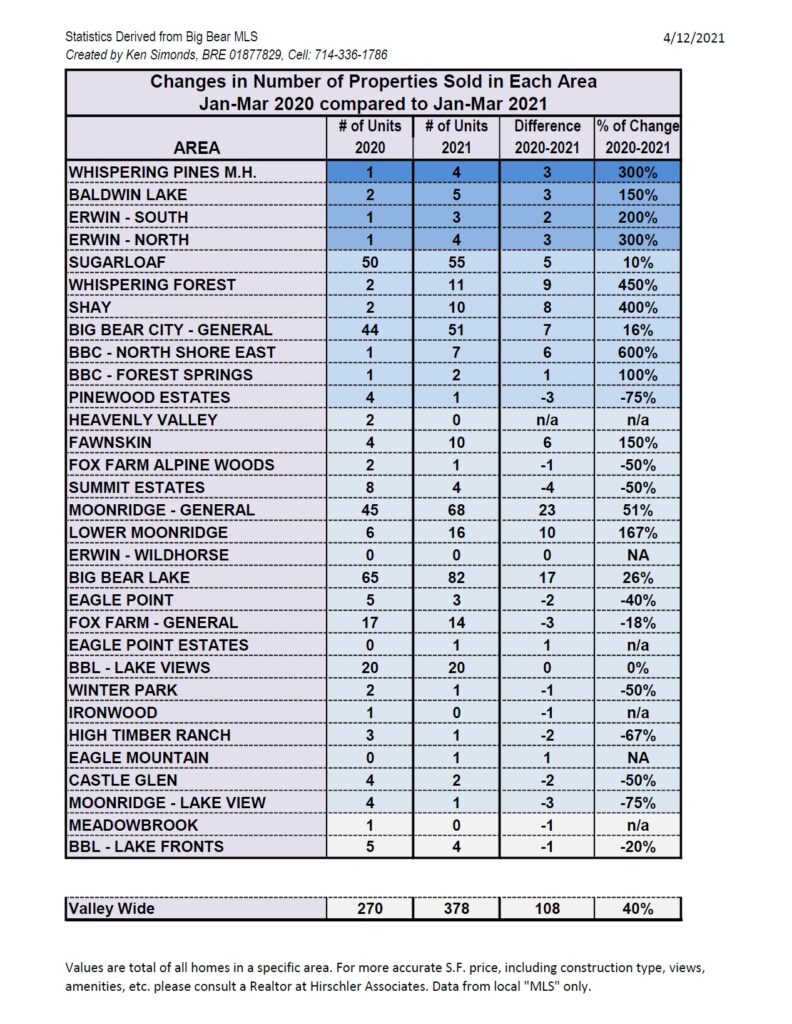
Sold Jan-Mar 2021 – 377 units
$0-300,000k – 66 units – 18% of sold units
$300,001-500k – 179 units – 47% of sold units
$500,001-800k – 97 units – 26% of sold units
$800,001 plus – 35 units – 9% of sold units
Big Bear Market Stats as of March 1, 2021
Price breakdown as of March 1, 2021
$0-300,000K – 12 units – 18% of inventory
$300,001-500k – 26 units – 38% of inventory
$500,001-800k – 8 units – 12% of inventory
$800,001k plus – 22 units – 32% of inventory
Sold Jan-Feb 2021 – 236 units
$0-300,000k – 51 units – 22% of sold units
$300,001-500k – 117 units – 49% of sold units
$500,001-800k – 51 units – 22% of sold units
$800,001 plus – 17 units – 7% of sold units