

Big Bear Market Stats as of January 1st, 2024
Price breakdown as of January 1, 2024
$0-300,000K – 16 units – 6% of inventory
$300,001-500k – 88 units – 32% of inventory
$500,001-800k – 94 units – 34% of inventory
$800,001k plus – 78 units – 28% of inventory
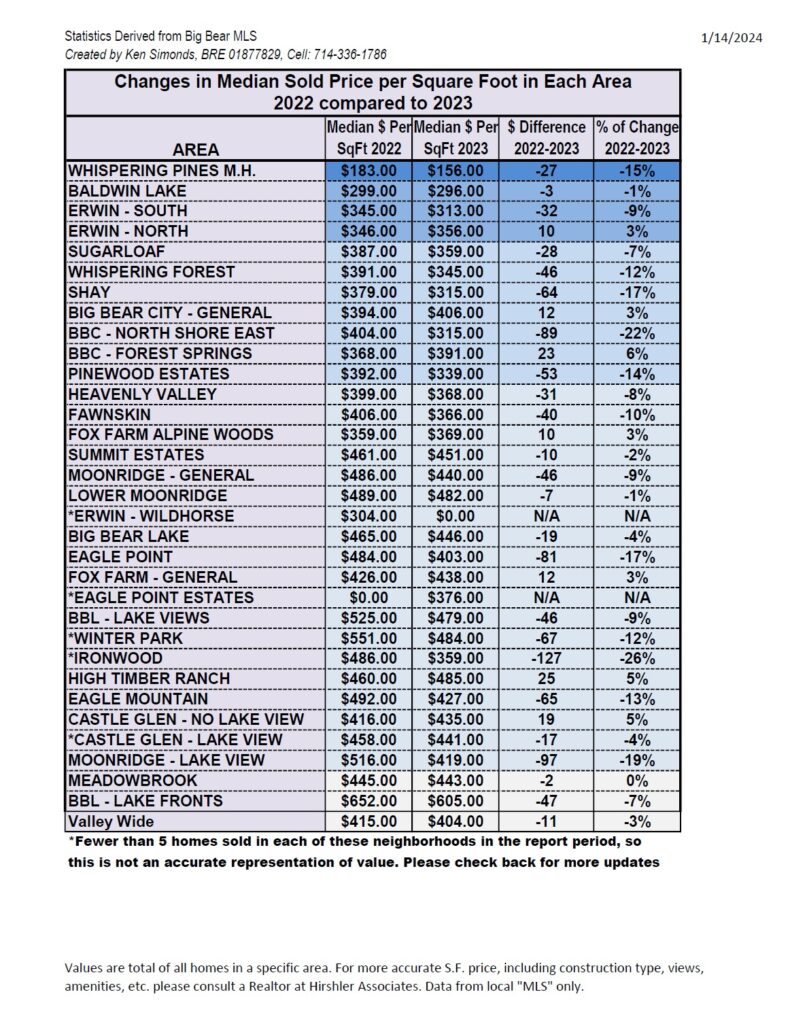
Sold Jan-Dec 2023– 784 units
$0-300,000k – 69 units – 9% of sold units
$300,001-500k – 331 units – 42% of sold units
$500,001-800k – 247 units – 32% of sold units
$800,001 plus – 137 units – 17% of sold units
Big Bear Market Stats as of December 1st,2023
Price breakdown as of December 1, 2023
$0-300,000K – 17 units – 5% of inventory
$300,001-500k – 102 units – 31% of inventory
$500,001-800k – 109 units – 34% of inventory
$800,001k plus – 99 units – 30% of inventory
Sold Jan-Nov 2023– 715 units $0-300,000k – 64 units – 9% of sold units
$300,001-500k – 297 units – 41% of sold units
$500,001-800k – 227 units – 32% of sold units
$800,001 plus – 127 units – 18% of sold units

Big Bear Market Stats as of November 1st,2023
Price breakdown as of November 1, 2023
$0-300,000K – 21 units – 6% of inventory
$300,001-500k – 114 units – 31% of inventory
$500,001-800k – 127 units – 35% of inventory
$800,001k plus – 100 units – 28% of inventory
Sold Jan-Oct 2023– 662 units
$0-300,000k – 60 units – 9% of sold units
$300,001-500k – 273 units – 41% of sold units
$500,001-800k – 207 units – 31% of sold units
$800,001 plus – 122 units – 19% of sold units

Big Bear Market Stats as of October 1st,2023
Price breakdown as of October 1, 2023
$0-300,000K – 18 units – 5% of inventory
$300,001-500k – 117 units – 31% of inventory
$500,001-800k – 143 units – 38% of inventory
$800,001k plus – 100 units – 26% of inventory
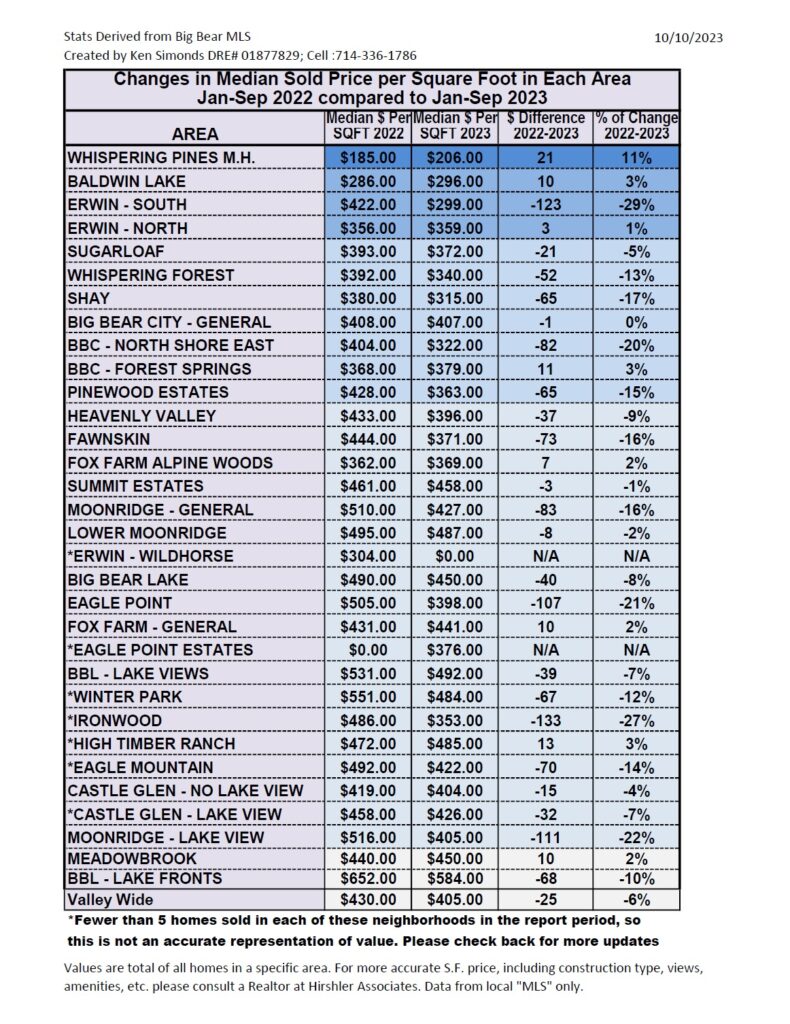
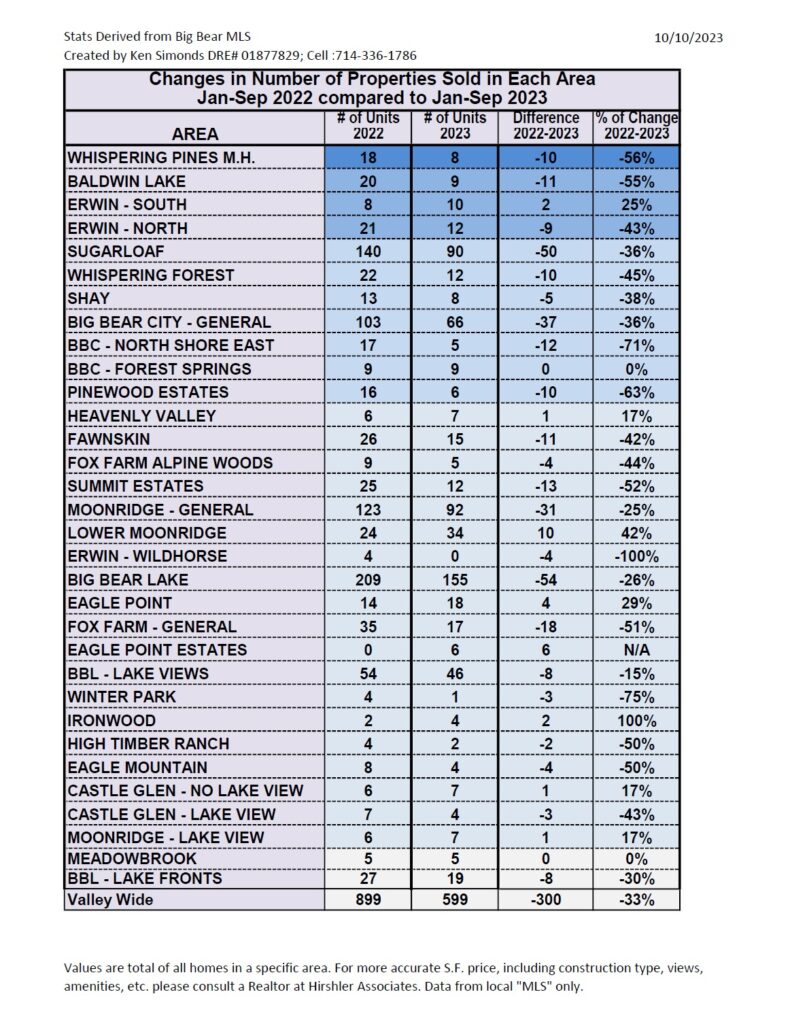
Sold Jan-Sep 2023– 599 units
$0-300,000k – 55 units – 9% of sold units
$300,001-500k – 239 units – 40% of sold units
$500,001-800k – 196 units – 33% of sold units
$800,001 plus – 109 units – 18% of sold units