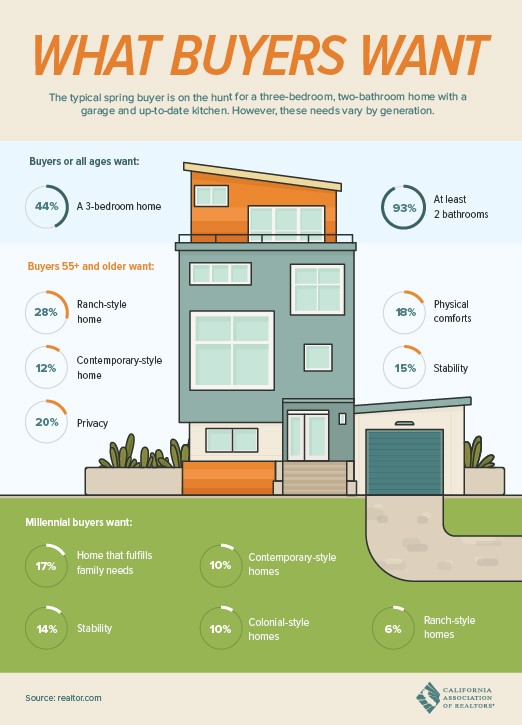
What Buyers Want June 15, 2018 By Cathy McCabe Share this:Tweet Print (Opens in new window) Print More Email a link to a friend (Opens in new window) Email Like this:Like Loading…
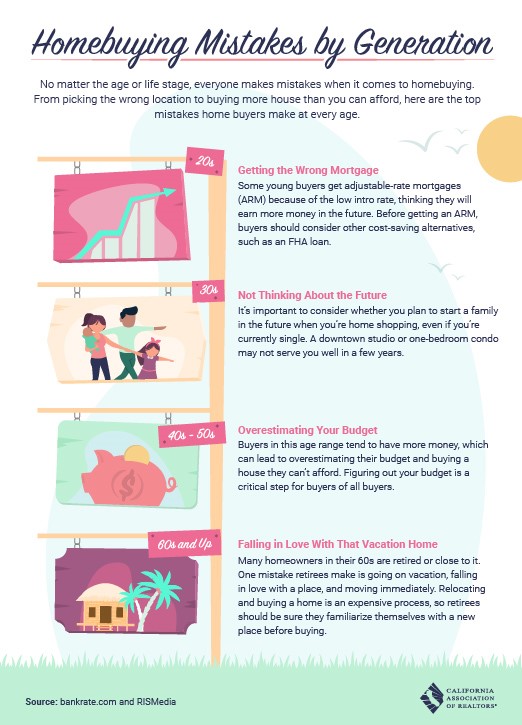
Homebuying Mistakes by Generation June 15, 2018 By Cathy McCabe Share this:Tweet Print (Opens in new window) Print More Email a link to a friend (Opens in new window) Email Like this:Like Loading…
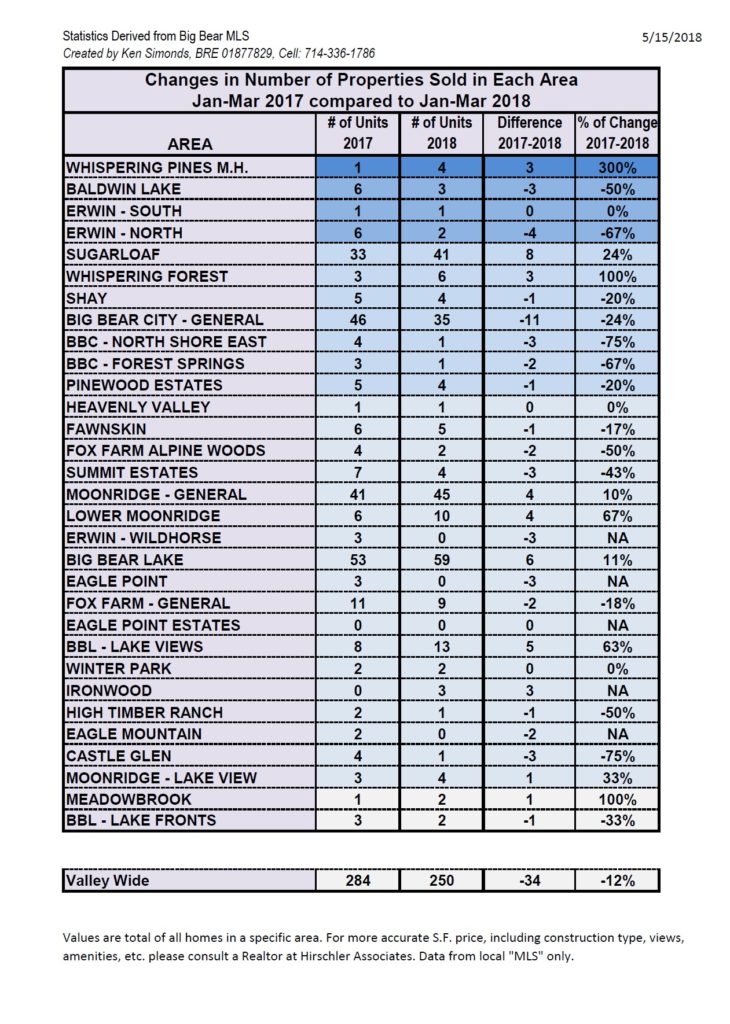
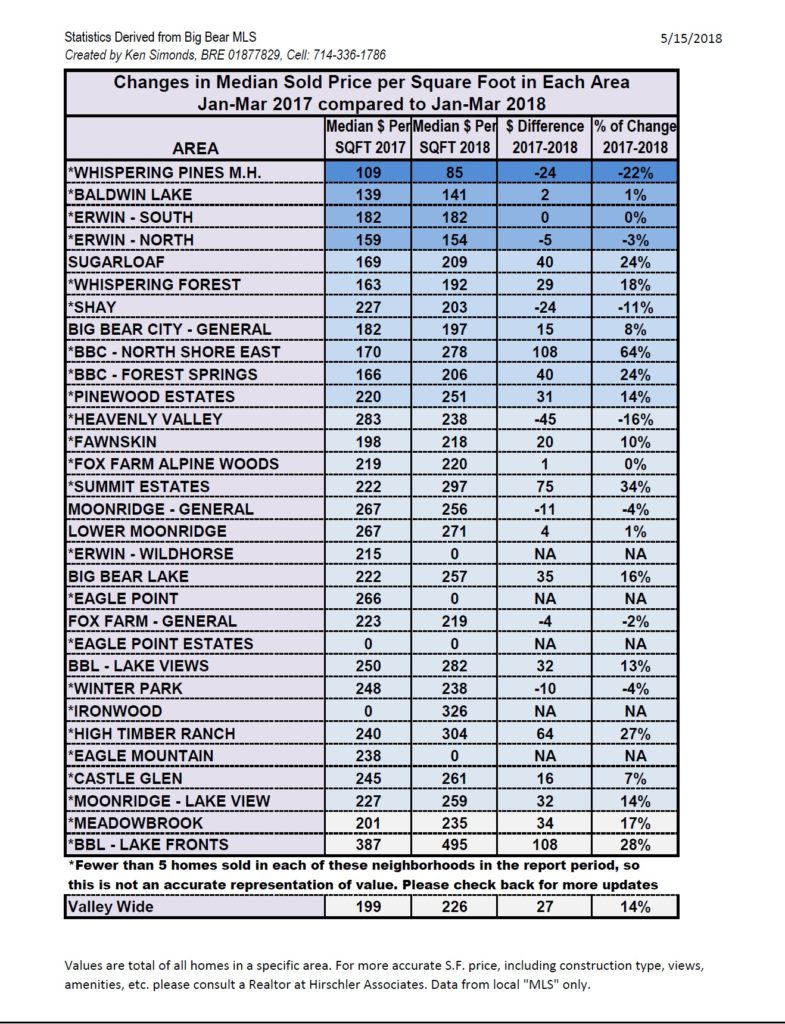
First Quarter 2017 over 2018 Units Sold and Sold Price Per Square Foot with Rate of Change May 15, 2018 By Cathy McCabe Share this:Tweet Print (Opens in new window) Print More Email a link to a friend (Opens in new window) Email Like this:Like Loading…
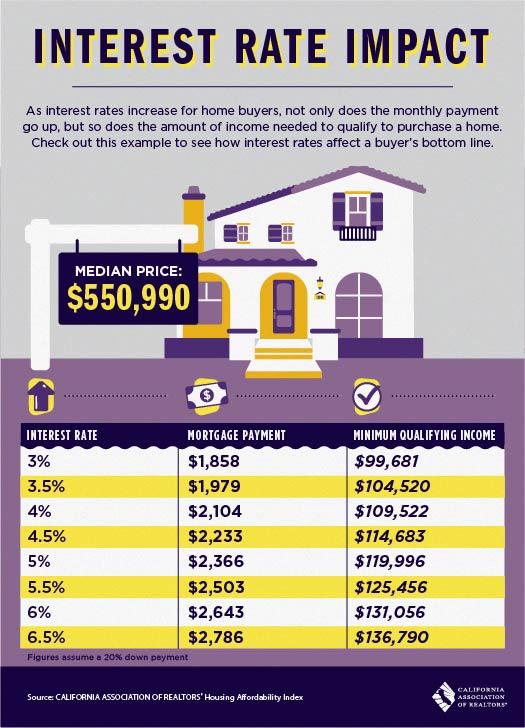
Interest Rate Impact May 8, 2018 By Cathy McCabe Share this:Tweet Print (Opens in new window) Print More Email a link to a friend (Opens in new window) Email Like this:Like Loading…
Market Statistics as of May 2nd, 2018 May 3, 2018 By Cathy McCabe Spring Snow at the Home Office Big Bear Market Stats as of May 2, 2018 Total Active Residential Properties: 379 (9% increase from April 2nd) May 2nd 2017 reported 426 Total Residential Properties in Back-Up and Pending: 146 (17% increase from April 2nd) Total Residential Properties Sold in April: 78 (20% decrease from March) *97 properties sold in April 2017, and 85 sold in April 2016. 96 Sold in March 70 Sold in February 79 Sold in January 110 Sold in December 147 Sold in November 168 Sold in October New Residential Listings in April: 154 (2% decrease from 157 in March) 17% of Current Market has been reduced in price in April. Properties sold from January 1st 2018 to April 30th 2018: 328 (12% decrease from 374 in January- April 2017) Total Sales Volume January 1st 2018 to April 30th 2018: $113,435,605 (1% decrease from $115,030,412 in January-April 2017) Share this:Tweet Print (Opens in new window) Print More Email a link to a friend (Opens in new window) Email Like this:Like Loading…
Market Stats as of April 2nd, 2018 April 2, 2018 By Cathy McCabe Big Bear Market Stats as of April 2, 2018 Total Active Residential Properties: 345 (15% increase from March 1st) April 3rd 2017 reported 369 Total Residential Properties in Back-Up and Pending: 122 (15% decrease from March 1st) Total Residential Properties Sold in March: 96 (37% increase from February) *111 properties sold in March 2017, and 115 sold in March 2016. 70 Sold in February 79 Sold in January 110 Sold in December 147 Sold in November 168 Sold in October 166 Sold in September New Residential Listings in March: 154 (14% increase from 132 in February) 17% of Current Market has been reduced in price in March. Properties sold from January 1st 2018 to March 31st 2018: 248 (10% decrease from 277 in January- March 2017) Total Sales Volume January 1st 2018 to March 31st 2018: $85,224,495 (1% decrease from $85,942,073 in January-March 2017) Share this:Tweet Print (Opens in new window) Print More Email a link to a friend (Opens in new window) Email Like this:Like Loading…
 Spring Snow at the Home Office