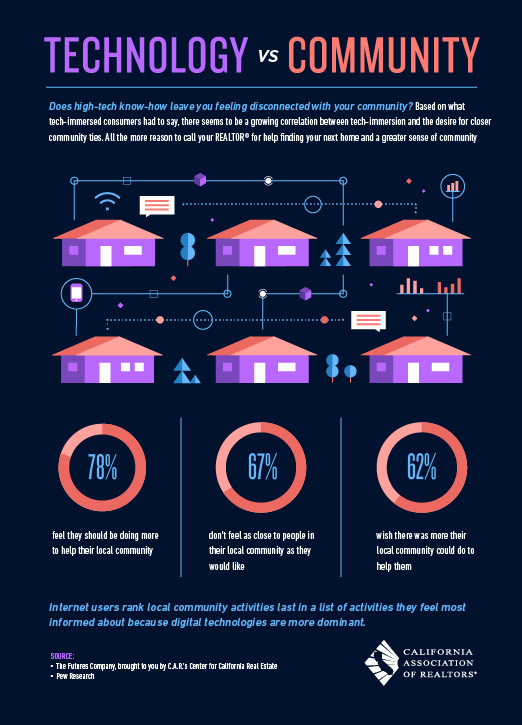
 With our help, you can have the best of both worlds!

Market Statistics for Big Bear Lake, CA as of February 3, 2016
Market Statistics for Big Bear Lake, CA as of February 3, 2016
- Total Active Residential Properties: 397 (11% decrease from January 6th)
- Total Residential Properties in Back-Up and Pending: 140 (14% increase from January 6th)
- Total Residential Properties Sold in January: 65 (44% decrease from December)
- 118 Sold in December
105 Sold in November
121 Sold in October
118 Sold in September
112 Sold in August
112 Sold in July
107 Sold in June
97 Sold in May - New Residential Listings In January: 90 (24% decrease from December)
- 11% of Current Market has been reduced in price since January 1st.
Share this:

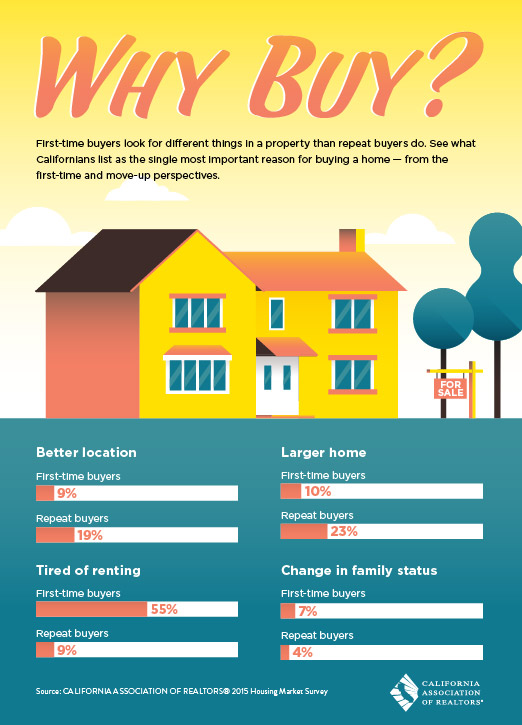
Why Buy?
Share this:

Lakefront Market Statistics
Total Active Lakefront Listings: 13
Total Lakefronts Sold in Last 12 Months: 19
Dollar Total of Big Bear Lake Properties Sold as Lakefronts in last 12 months: 26%
Unit Total of Big Bear Lake Properties Sold as Lakefronts in Last 12 Months: 8%
Share this:

Renovation Realities-What Does an Average California Reno Cost?
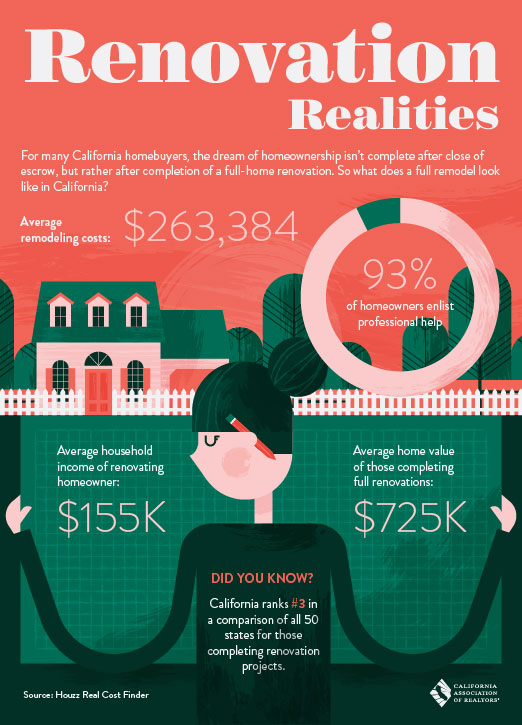
Thanks to the California Association of Realtors for providing this useful infographic outlining the average costs of remodel projects, and the value these renovations add to the home.
Share this:

Local Market Stats for Big Bear as of January 6th, 2016
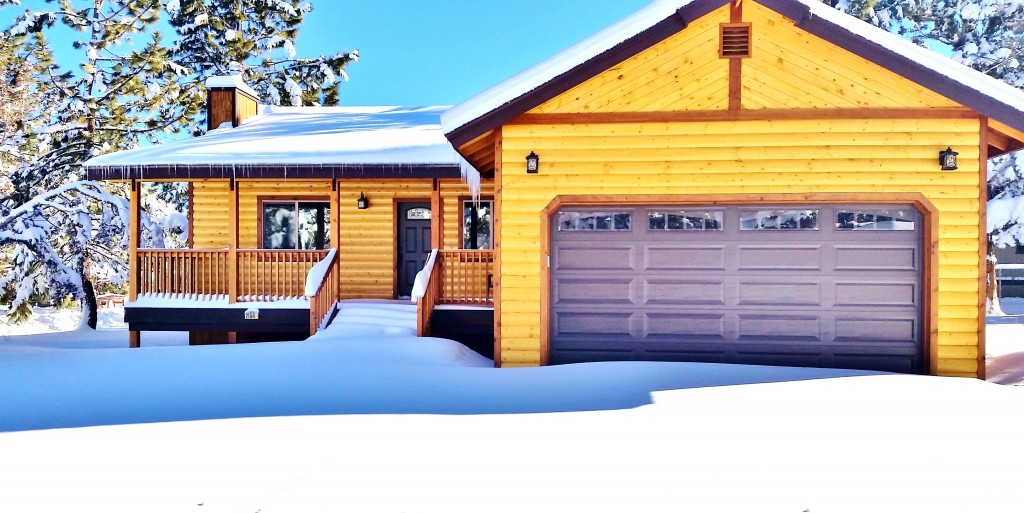
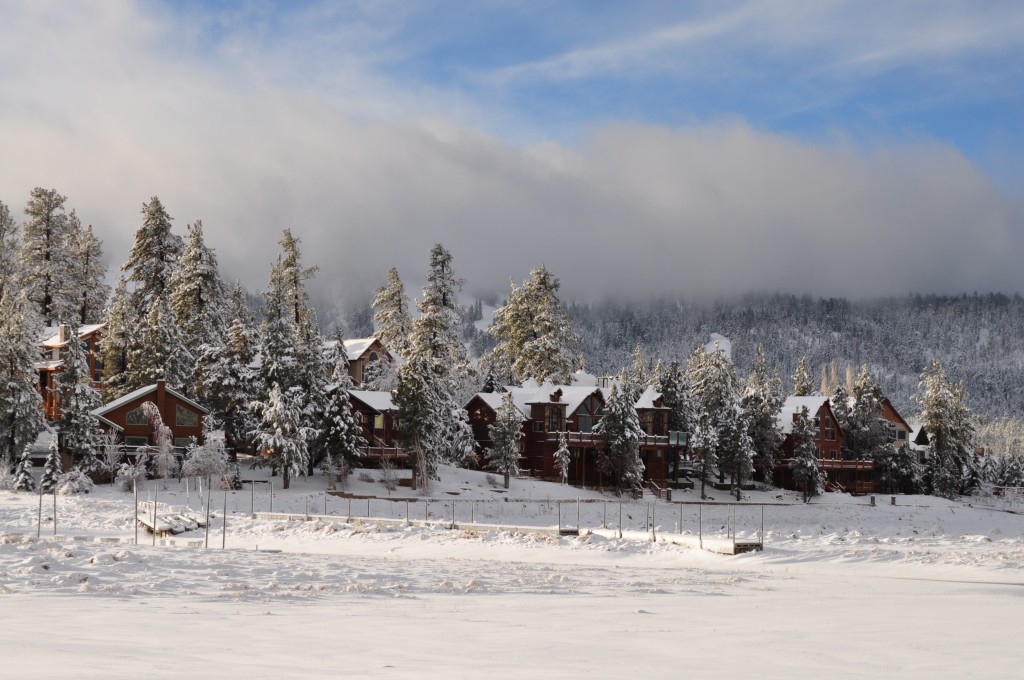
 Photo Courtesy of Cathy McCabe
Market Statistics for Big Bear Lake, CA as of January 6th, 2016
- Total Active Residential Properties: 447 (8% decrease from December 1st)
- Total Residential Properties in Back-Up and Pending: 120 (32% decrease from December 1st)
- Total Residential Properties Sold in Dec: 118 (12% Increase from November)
105 Sold in November
121 Sold in October
118 Sold in September
112 Sold in August
112 Sold in July
107 Sold in June
97 Sold in May
85 Sold in April - New Residential Listings In December: 118 (13% Increase from November)
- 11% of Current Market has been reduced in price since December 1st.
Share this:

- « Previous Page
- 1
- …
- 46
- 47
- 48
- 49
- 50
- …
- 52
- Next Page »