Big Bear Market Stats as of February 1st, 2024
Total Active Residential Properties: 251 (9% decrease from January) February 2023
reported 195
Total Residential Properties in Back-Up and Pending: 72 (33% increase from January)
Total Residential Properties Sold in January: 50 (26% decrease from December)
54 properties sold in January 2023, and 97 sold in January 2022.
68 Sold in December
54 Sold in November
63 Sold in October
71 Sold in September
81 Sold in August
74 Sold in July
New Residential Listings in January: 57 (10% increase from 52 in December)
14% of Current Market was reduced in price in January.
Properties sold from January 1st 2024 to January 31st 2024: 50 (7% decrease from
54 in January 2023)
Total Sales Volume January 1st 2024 to January 31st 2024: $26,150,862 (18%
decrease from $31,816,142 in January 2023)
Price breakdown as of February 1, 2024
$0-300,000K – 13 units – 5% of inventory
$300,001-500k – 78 units – 31% of inventory
$500,001-800k – 90 units – 36% of inventory
$800,001k plus – 70 units – 28% of inventory
Sold Jan 2024– 50 units
$0-300,000k – 7 units – 14% of sold units
$300,001-500k – 19 units – 38% of sold units
$500,001-800k – 19 units – 38% of sold units
$800,001 plus – 5 units – 10% of sold units
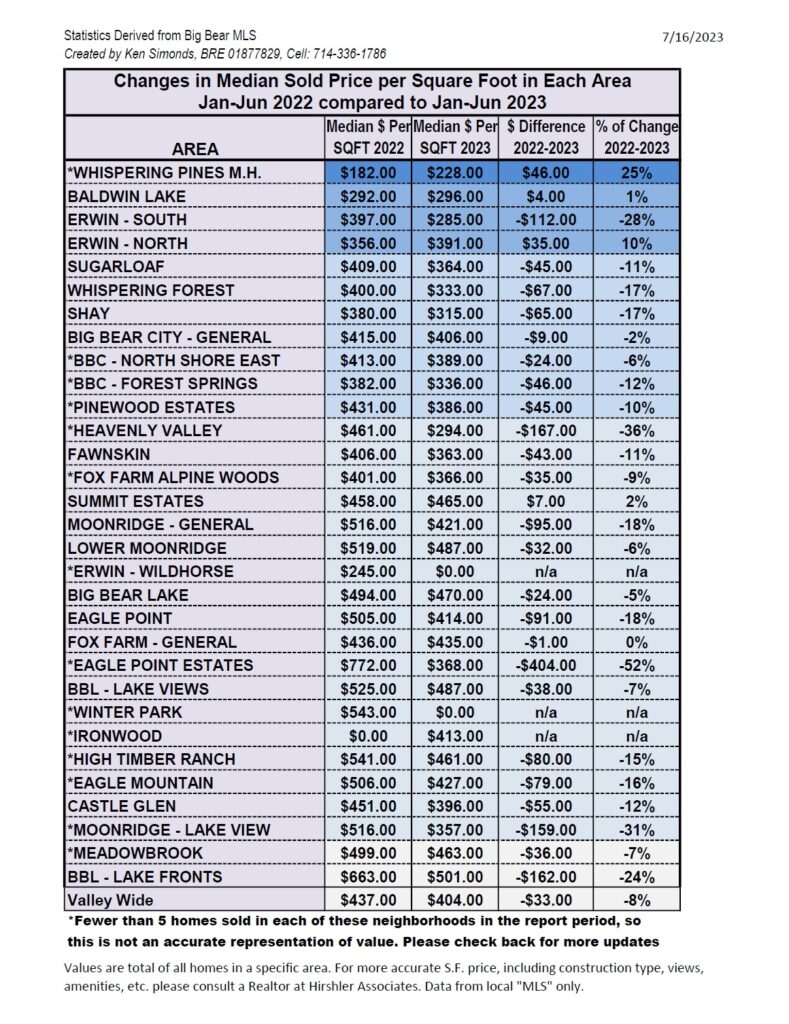
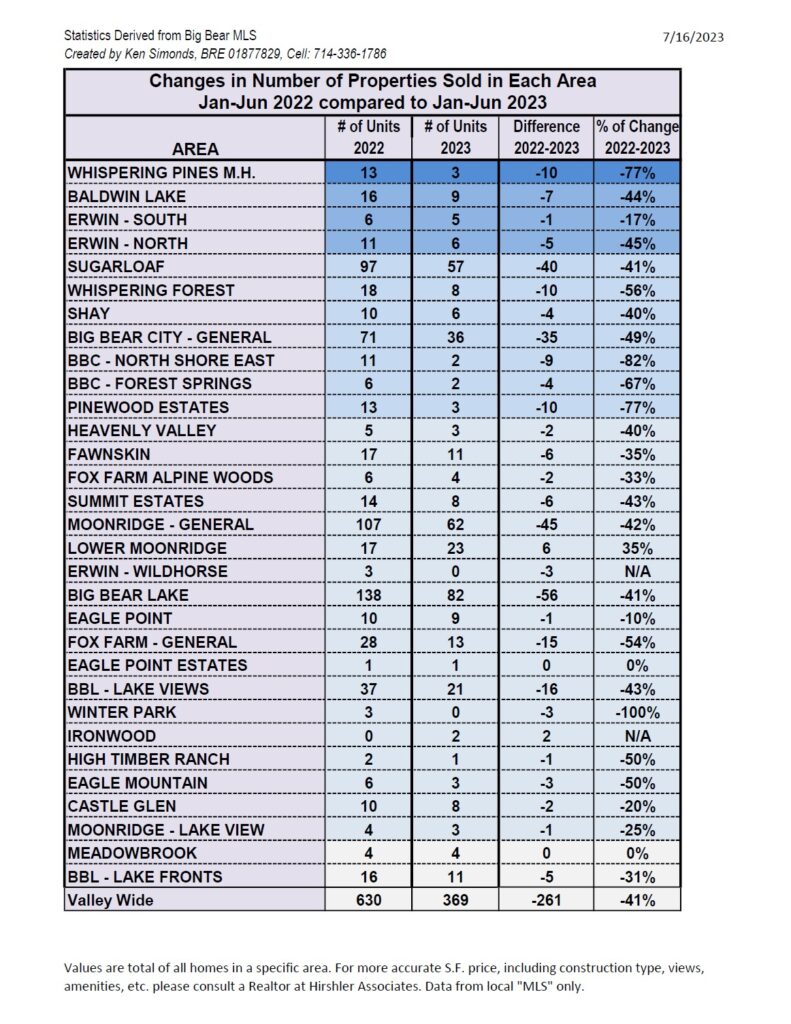
Changes in Median Sold Price per Square Foot and Units Sold in Each Area Jan-Dec 2022 compared to Jan-Dec 2023
Big Bear Market Statistics as of January 1st, 2024
Big Bear Market Stats as of January 1st, 2024
- Total Active Residential Properties: 276 (15% decrease from December) January 2023 reported 217
- Total Residential Properties in Back-Up and Pending: 54 (28% decrease from December)
- Total Residential Properties Sold in December: 68 (21% increase from November)
53 properties sold in December 2022, and 106 sold in December 2021. - 54 Sold in November
63 Sold in October
71 Sold in September
81 Sold in August
74 Sold in July
64 Sold in June - New Residential Listings in December: 52 (19% decrease from 64 in November)
- 17% of Current Market was reduced in price in December.
- Properties sold from January 1st 2023 to December 31st 2023: 784 (30% decrease from 1128 in January-December 2022)
- Total Sales Volume January 1st 2023 to December 31st 2023: $489,786,852 (31% decrease from $713,151,781 in January-December 2022)
Price breakdown as of January 1, 2024
$0-300,000K – 16 units – 6% of inventory
$300,001-500k – 88 units – 32% of inventory
$500,001-800k – 94 units – 34% of inventory
$800,001k plus – 78 units – 28% of inventory
Sold Jan-Dec 2023– 784 units
$0-300,000k – 69 units – 9% of sold units
$300,001-500k – 331 units – 42% of sold units
$500,001-800k – 247 units – 32% of sold units
$800,001 plus – 137 units – 17% of sold units
Big Bear Market Stats as of December 1, 2023
Big Bear Market Stats as of December 1st,2023
- Total Active Residential Properties: 327 (10% decrease from November) December 2022 reported 268
- Total Residential Properties in Back-Up and Pending: 75 (10% increase from November)
- Total Residential Properties Sold in November: 53 (16% decrease from October)
63 properties sold in November 2022, and 167 sold in November 2021. - 63 Sold in October
71 Sold in September
81 Sold in August
74 Sold in July
64 Sold in June
88 Sold in May - New Residential Listings in November: 64 (34% decrease from 97 in October)
- 22% of Current Market was reduced in price in November.
- Properties sold from January 1st 2023 to November 30th 2023: 715 (33% decrease from 1075 in January-November 2022)
- Total Sales Volume January 1st 2023 to November 30th 2023: $446,533,822 (35% decrease from $684,617,781 in January-November 2022)
Price breakdown as of December 1, 2023
$0-300,000K – 17 units – 5% of inventory
$300,001-500k – 102 units – 31% of inventory
$500,001-800k – 109 units – 34% of inventory
$800,001k plus – 99 units – 30% of inventory
Sold Jan-Nov 2023– 715 units $0-300,000k – 64 units – 9% of sold units
$300,001-500k – 297 units – 41% of sold units
$500,001-800k – 227 units – 32% of sold units
$800,001 plus – 127 units – 18% of sold units
Big Bear Market Stats as of November 1, 2023
Big Bear Market Stats as of November 1st,2023
- Total Active Residential Properties: 362 (4% decrease from October) November 2022 reported 282
- Total Residential Properties in Back-Up and Pending: 68 (9% decrease from October)
- Total Residential Properties Sold in October: 63 (11% decrease from September)
102 properties sold in October 2022, and 160 sold in October 2021. - 71 Sold in September
81 Sold in August
74 Sold in July
64 Sold in June
88 Sold in May
51 Sold in April - New Residential Listings in October: 97 (4% decrease from 101 in September)
- 27% of Current Market was reduced in price in October.
- Properties sold from January 1st 2023 to October 31st 2023: 662 (35% decrease from 1012 in January-October 2022)
- Total Sales Volume January 1st 2023 to October 31st 2023: $415,803,972 (36% decrease from $650,618,872 in January-October 2022)
Price breakdown as of November 1, 2023
$0-300,000K – 21 units – 6% of inventory
$300,001-500k – 114 units – 31% of inventory
$500,001-800k – 127 units – 35% of inventory
$800,001k plus – 100 units – 28% of inventory
Sold Jan-Oct 2023– 662 units
$0-300,000k – 60 units – 9% of sold units
$300,001-500k – 273 units – 41% of sold units
$500,001-800k – 207 units – 31% of sold units
$800,001 plus – 122 units – 19% of sold units
Changes in Median Sold Price per Square Foot and Units Sold in Each Area Jan-Sep 2022 compared to Jan-Sep 2023
- « Previous Page
- 1
- 2
- 3
- 4
- 5
- …
- 50
- Next Page »