By Cathy McCabe


By Cathy McCabe

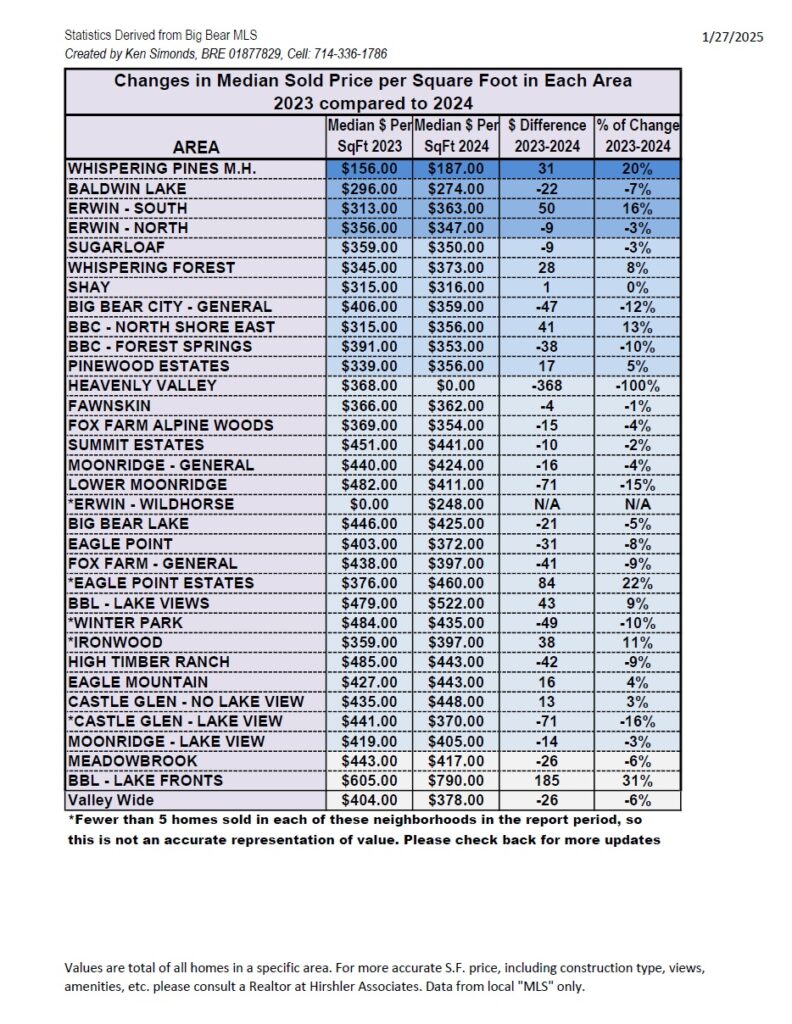
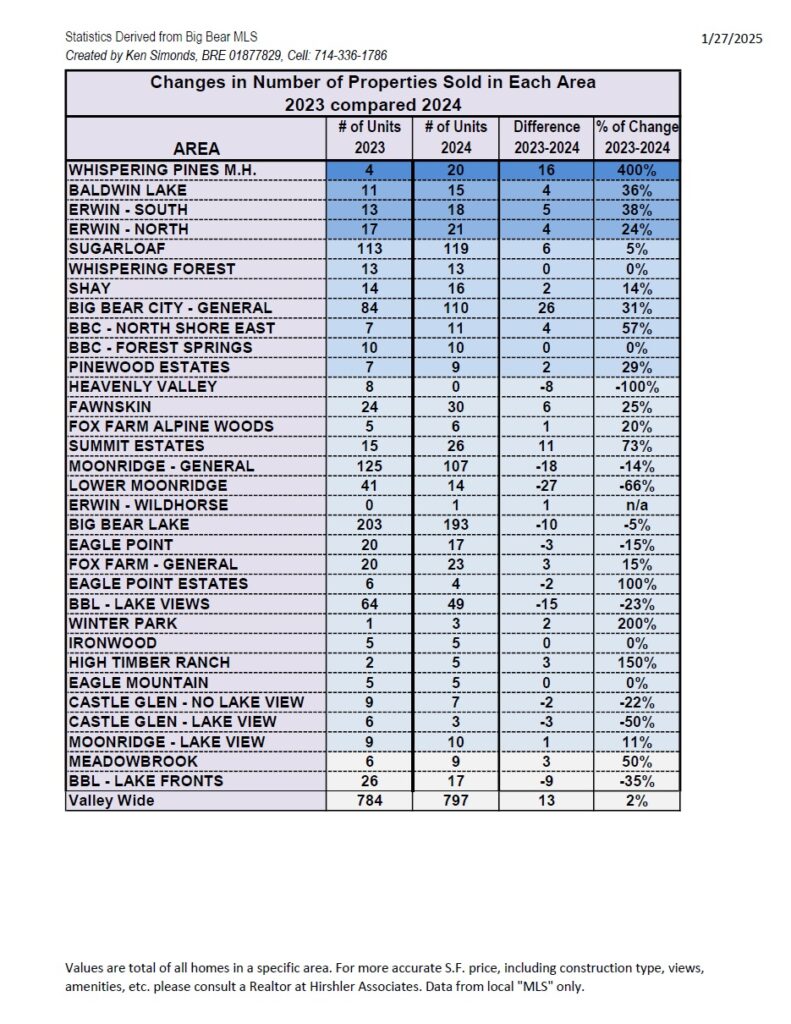
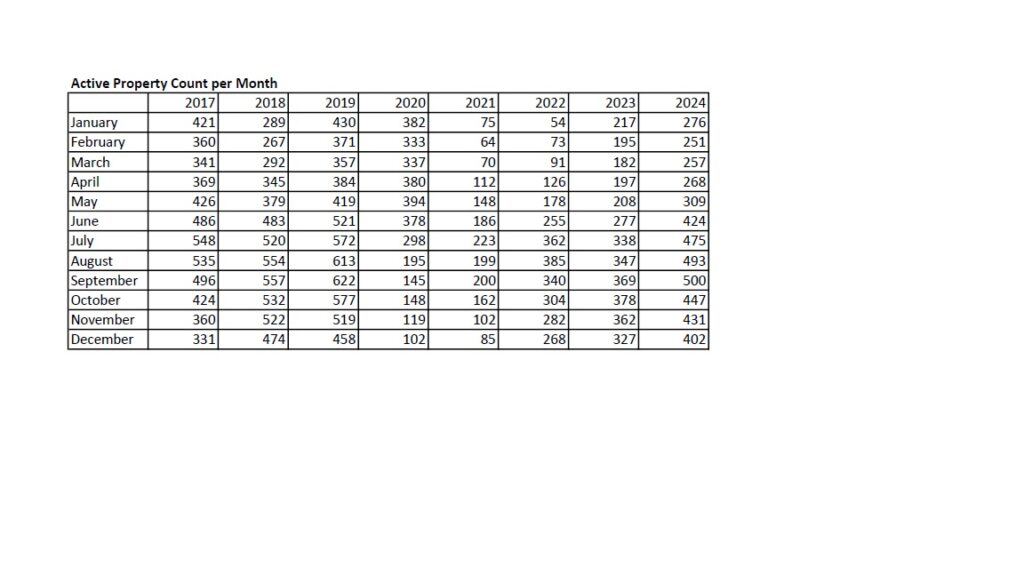
Big Bear Market Stats as of December 1st, 2024
Price breakdown as of December 1, 2024
$0-300,000K – 31 units – 8% of inventory
$300,001-500k – 164 units – 40% of inventory
$500,001-800k – 123 units – 31% of inventory
$800,001k plus – 84 units – 21% of inventory
Sold Jan-Nov 2024– 712 units
$0-300,000k – 83 units – 12% of sold units
$300,001-500k – 279 units – 39% of sold units
$500,001-800k – 231 units – 32% of sold units
$800,001 plus – 119 units – 17% of sold units
By Cathy McCabe
By Cathy McCabe
Price breakdown as of November 1, 2024
$0-300,000K – 35 units – 8% of inventory
$300,001-500k – 173 units – 40% of inventory
$500,001-800k – 134 units – 31% of inventory
$800,001k plus – 89 units – 21% of inventory
Sold Jan-Oct 2024– 638 units
$0-300,000k – 73 units – 12% of sold units
$300,001-500k – 257 units – 40% of sold units
$500,001-800k – 206 units – 32% of sold units
$800,001 plus – 102 units – 16% of sold units
By Cathy McCabe
By Cathy McCabe
Big Bear Market Stats as of October 1st, 2024
Price breakdown as of October 1, 2024
$0-300,000K – 34 units – 7% of inventory
$300,001-500k – 177 units – 40% of inventory
$500,001-800k – 143 units – 32% of inventory
$800,001k plus – 93 units – 21% of inventory
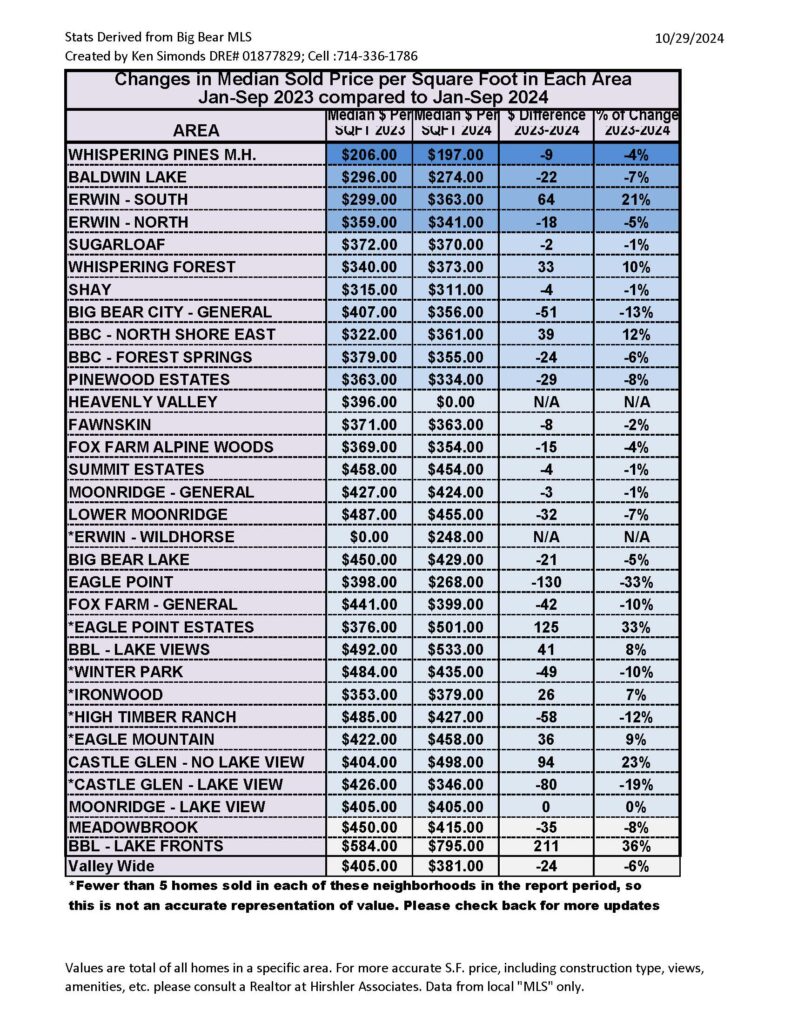
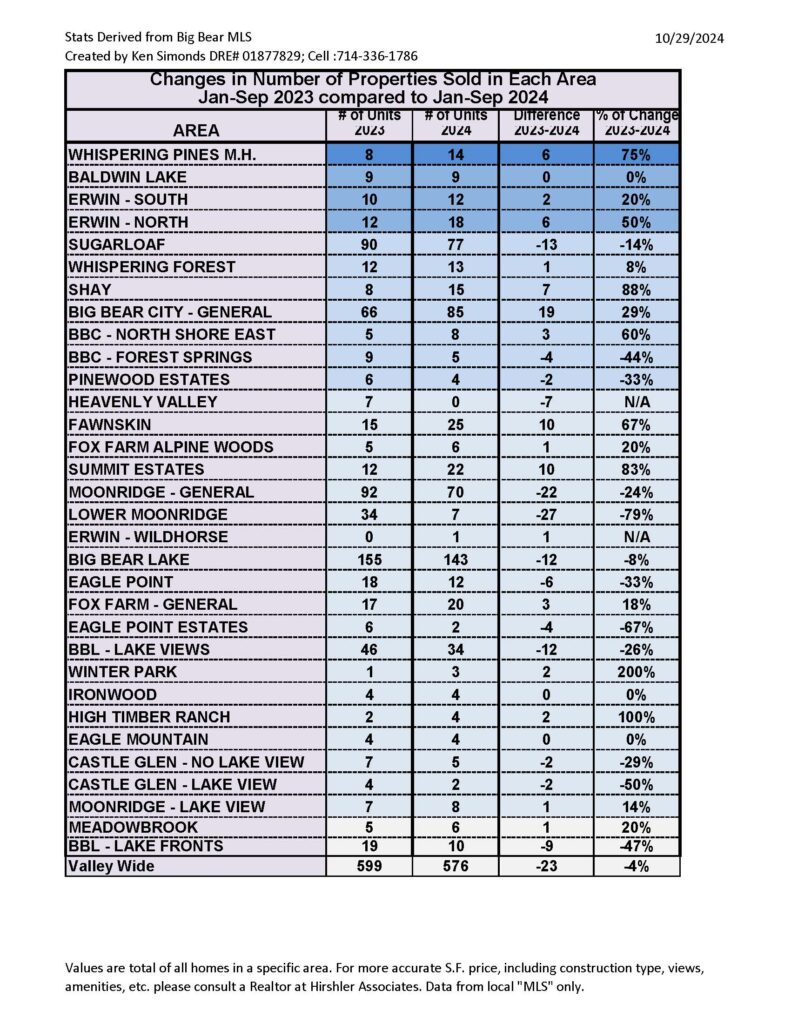
Sold Jan-Sep 2024– 576 units
$0-300,000k – 67 units – 12% of sold units
$300,001-500k – 229 units – 40% of sold units
$500,001-800k – 187 units – 32% of sold units
$800,001 plus – 93 units – 16% of sold units