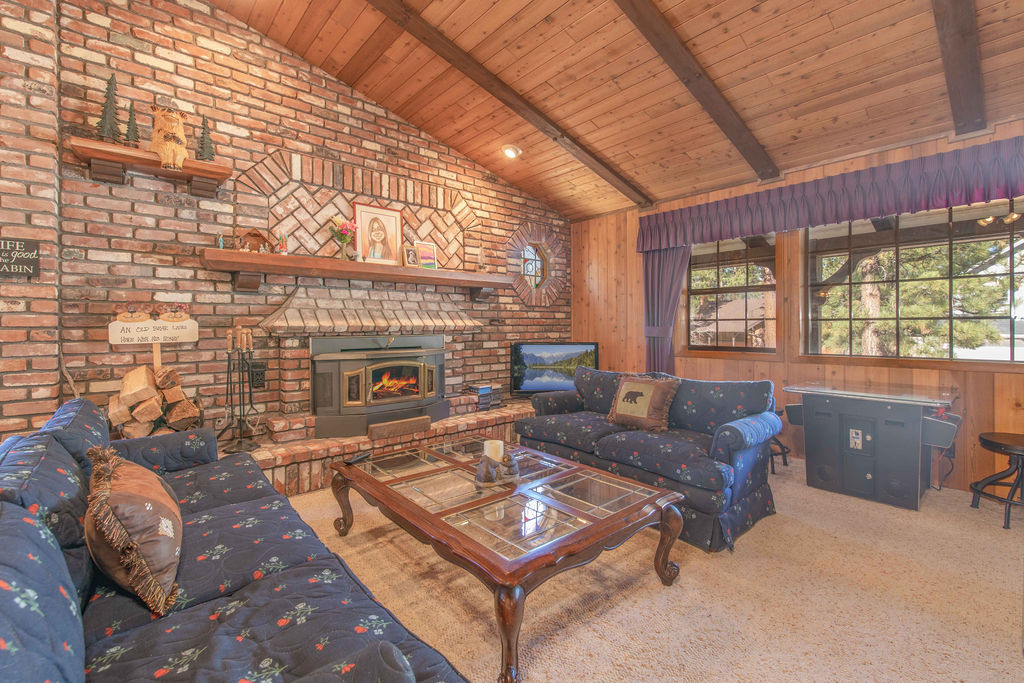
Great location and great home with good bones in this sought-after Gambrel style home located just blocks from forest roads with easy access for hiking. This classic Gambrel features wood beamed ceilings and extensive T&G accents throughout with classic wood burning fireplace in living room to cozy up to. 2-Bedrooms, 1-Main level full bath, with lots of storage closets throughout. Just needs some upgrades to make it your own. Large back deck with heavily treed backyard to relax and enjoy the sunrise/sunset or sip coffee, cocktails, etc. Fencing at front & right side of home. Parking for 2 cars in front or boat storage and large backyard. Great opportunity for investors, contractors or homeowner that wants to make upgrades. Easy access to Lucerne from Hwy 38 back way or Hwy 38 to Redlands, yet only 7.6 miles to Bear Mountain Slopes, 8.4 miles to Lake and Downtown Big Bear Lake Village for dining and entertainment. Would make a great permanent residence, 2nd home or vacation rental.
Big Bear Market Stats as of June 1st, 2022
Big Bear Market Stats as of June 1st,2022
- Total Active Residential Properties: 255 (43% increase from May) June 2021 reported 186
- Total Residential Properties in Back-Up and Pending: 117 (15% decrease from May)
- Total Residential Properties Sold in May: 104 (11% decrease from April)
151 properties sold in May 2021, and 53 sold in May 2020. - 117 Sold in April
132 Sold in March
77 Sold in February
91 Sold in January
106 sold in December
163 sold in November - New Residential Listings in May: 173 (3% increase from 167 in April)
- 29% of Current Market was reduced in price in May.
- Properties sold from January 1st 2022 to May 31st 2022: 529 (23% decrease from 683 in January-May 2021)
- Total Sales Volume January 1st 2022 to May 31st 2022: $352,488,837 (2% increase from $361,084,110 in January-May 2021)
Price breakdown as of June 1, 2022
$0-300,000K – 6 units – 2% of inventory
$300,001-500k – 87 units – 34% of inventory
$500,001-800k – 91 units – 36% of inventory
$800,001k plus – 71 units – 28% of inventory
*Sold Jan-May 2022– 529 units
$0-300,000k – 27 units – 5% of sold units
$300,001-500k – 181 units – 34% of sold units
$500,001-800k – 211 units – 40% of sold units
$800,001 plus – 110 units – 21% of sold units
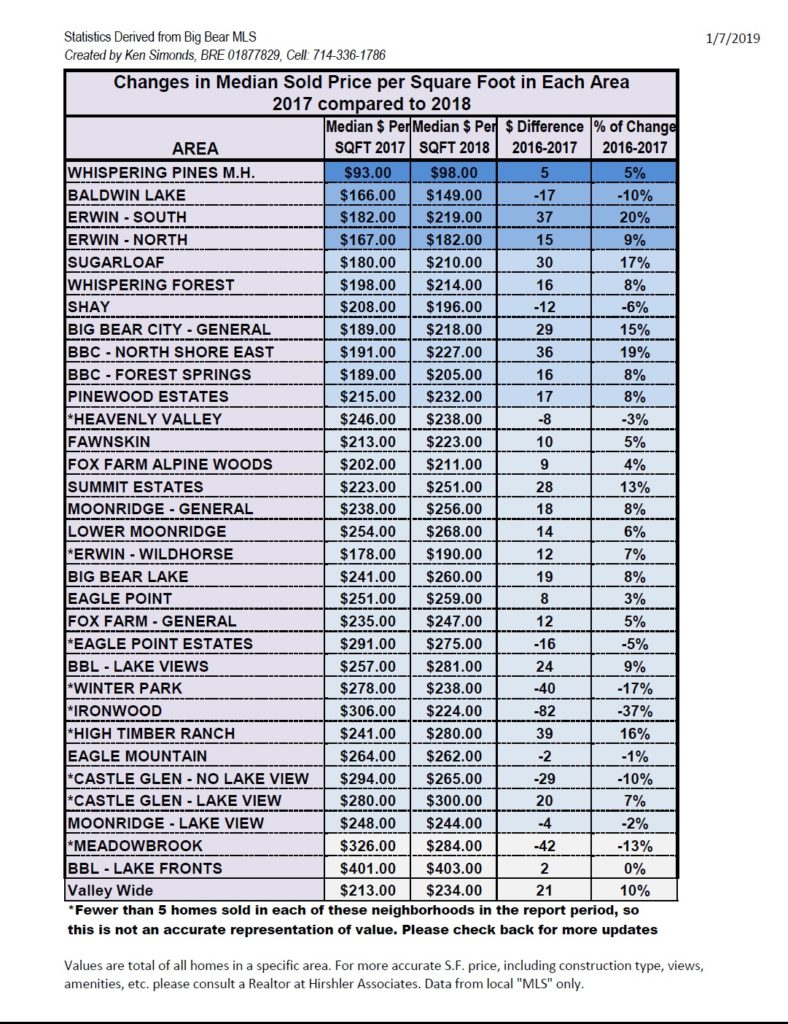
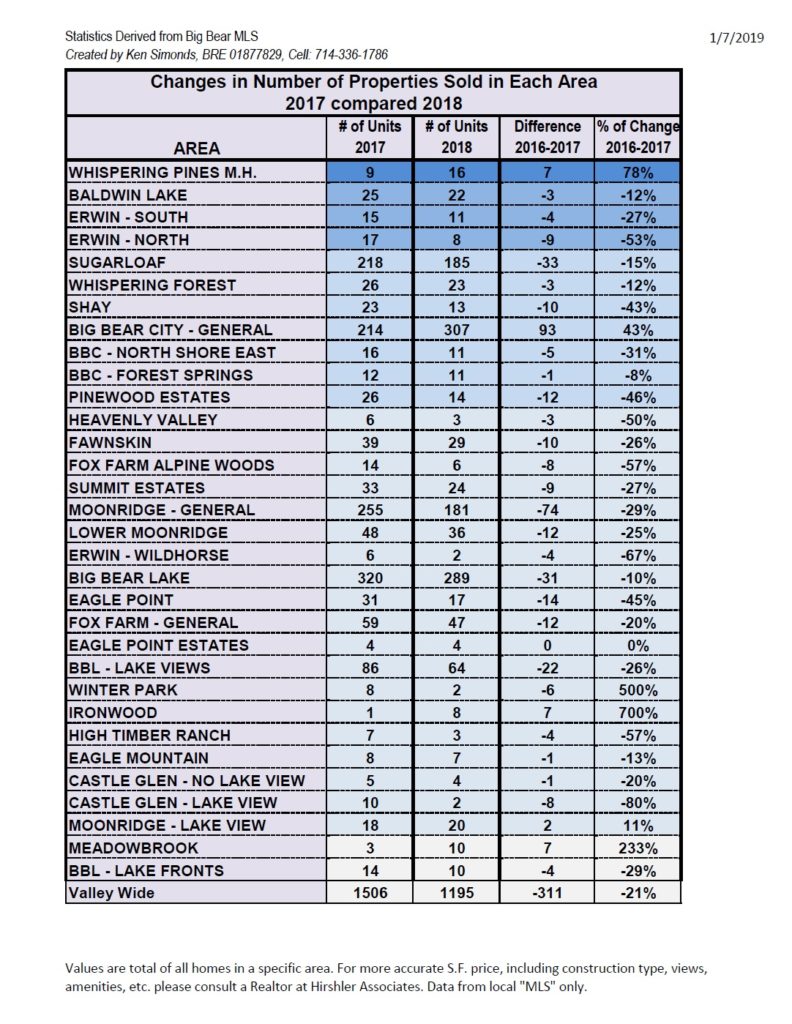
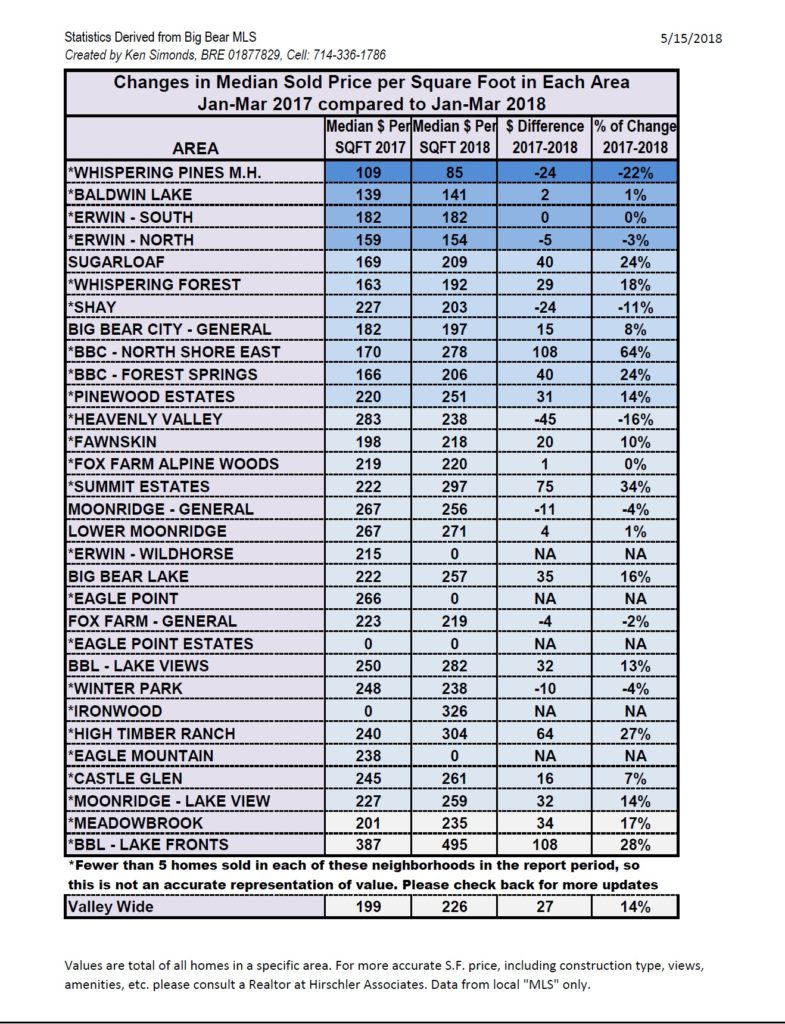
Median Sold Price per Square Foot and Units Sold 2017 Compared to 2018
Big Bear Market Stats as of January 7, 2019
Big Bear Market Stats as of January 7, 2019
- Total Active Residential Properties: 430 (9% decrease from December)
January 2018 reported 289 - Total Residential Properties in Back-Up and Pending: 108 (13% decrease from December)
- Total Residential Properties Sold in December: 80 (22% decrease
from November)
*116 properties sold in December 2017, and 109 sold in December 2016. - 102 Sold in November
122 Sold in October
118 Sold in September
122 Sold in August
97 Sold in July
100 Sold in June
110 Sold in May - New Residential Listings in December: 72 (36% decrease from 114 in November)
- 14% of Current Market has been reduced in price in December.
- Properties sold from January 1st 2018 to December 31st 2018: 1195 (21% decrease from 1506 in January-December 2017)
- Total Sales Volume January 1st 2018 to December 31st 2018: $400,534,894 (18% decrease from $489,605,356 in January-December 2017)
Price breakdown as of January 7, 2019
0-300K- 164 units
– 38.1% of inventory
301-500k- 117 units – 27.2% of inventory
501-800k- 67 units- 15.6% of inventory
801k and above – 82 units- 19.1% of inventory
Sold 2018 – 1195 units
0-300k – 667
units- 55.8% of sold units
301-500k- 381 units- 31.9% of sold units
501-800k – 108 units – 9.0% of sold units
801k and above – 39 units 3.3% of sold units
Market Stats for Big Bear as of August 1st, 2018
 Photo Courtesy of Cathy McCabe
Big Bear Market Stats as of August 1, 2018
- Total Active Residential Properties: 554 (6% increase from June)
August 2017 reported 535 - Total Residential Properties in Back-Up and Pending: 141 (1% increase from June)
- Total Residential Properties Sold in July: 97 (3% decrease from June)
*127 properties sold in July 2017, and 100 sold in July 2016. - 100 Sold in June
110 Sold in May
78 Sold in April
96 Sold in March
70 Sold in February
79 Sold in January
110 Sold in December - New Residential Listings in June: 178 (21% decrease from 225 in June)
- 20% of Current Market has been reduced in price in July.
- Properties sold from January 1st 2018 to July 31st 2018: 638 (14% decrease from 746 in January-July 2017)
- Total Sales Volume January 1st 2018 to July 31st 2018: $217,313,944 (5% decrease from $229,658,897 in January-June 2017)
Price breakdown
0-300K- 195 units – 35.2% of inventory
301-500k- 168 units – 30.3% of inventory
501-800k- 111 units- 20.0% of inventory
801k and above – 79 units- 14.3% of inventory
Sold YTD 2018 – 638 units
0-300k – 351 units- 55.0% of sold units
301-500k- 208 units- 32.5% of sold units
501-800k – 57 units – 8.9% of sold units
801k and above – 22 units 3.5% of sold units
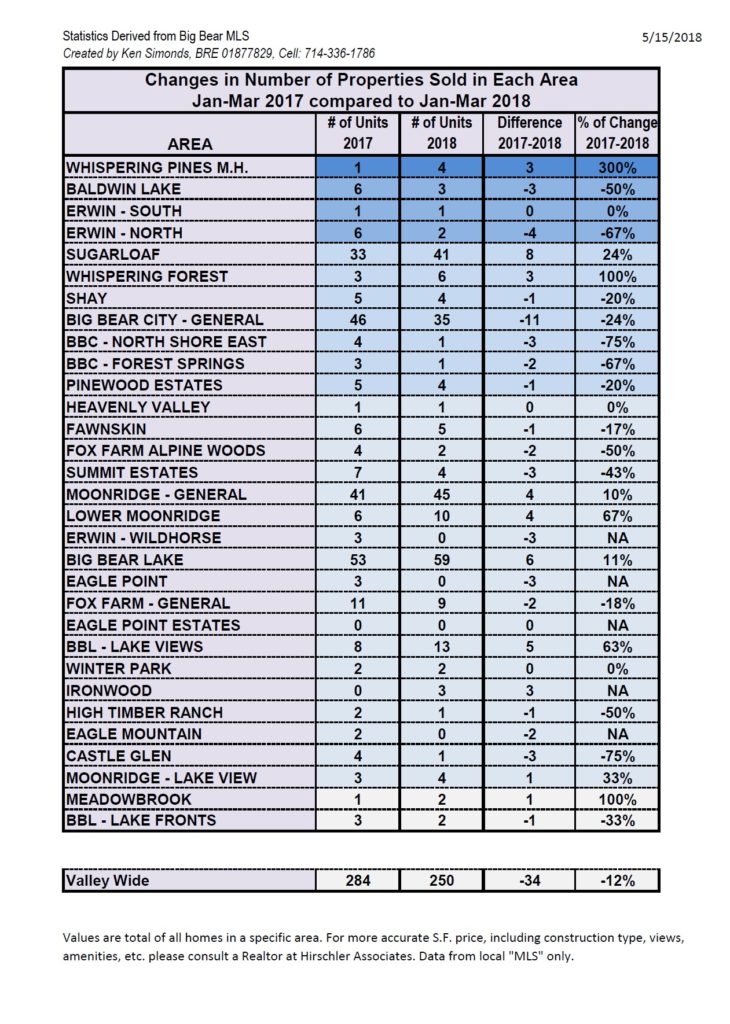
First Quarter 2017 over 2018 Units Sold and Sold Price Per Square Foot with Rate of Change
- 1
- 2
- 3
- …
- 5
- Next Page »
