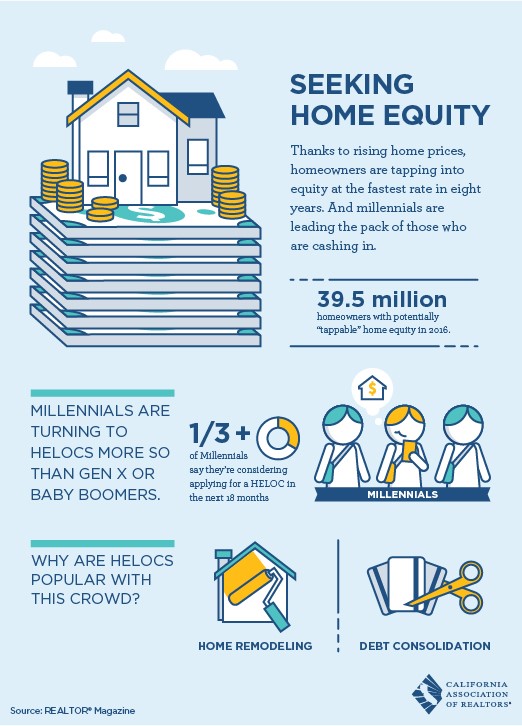
Millennials are moving less frequently than older generations were at their age. Of the ones who are, even fewer are moving into their own homes.
Big Bear Market Stats as of April 3rd, 2016
Big Bear Market Stats as of April 3rd, 2017
- Total Active Residential Properties: 369 (8% increase from March 7th)
- Total Residential Properties in Back-Up and Pending: 150 (2% decrease from March 7th)
- Total Residential Properties Sold in March: 108 (36% increase from February)
*115 properties sold in March 2016, and 93 sold in March 2015. - 69 Sold in February
83 Sold in January
108 Sold in December
117 Sold in November - New Residential Listings in March: 170 (42% increase from 98 in February)
- 12% of Current Market has been reduced in price since March 1st.
- Properties sold from January 1st 2017 to April 3rd 2017: 277 (4% increase from 265 in January 2016-April 2016)
- Total Sales Volume January 1st 2017 to April 3rd 2017: $87,557,474 (8% increase from $80,255,818 in January 2016-April 2016)
Mortgage Mayhem
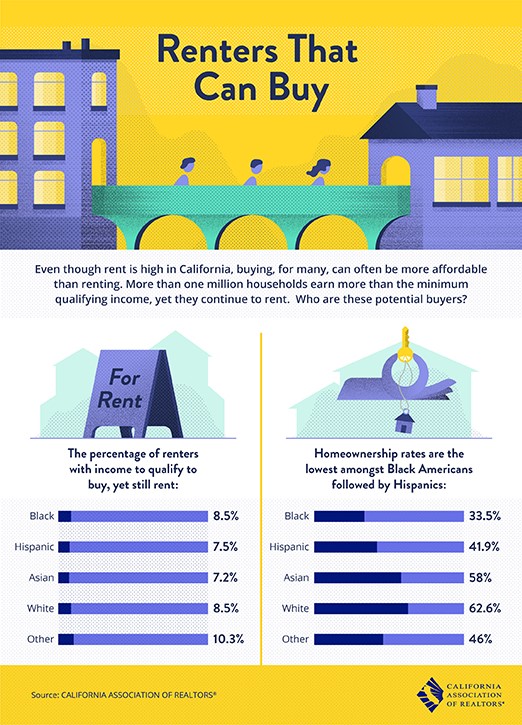
Since the mid-2000’s, homeownership has dropped. This is in part due to denial of mortgages. It is interesting to see what percentage of applicants in different racial groups have been denied, and why. Most applicants across the board are denied mortgages due to a too-high debt to income ratio.
Pet Power
Pet owners love Big Bear. Especially dog owners, who usually look for a fenced yard and close proximity to hiking trails.
Aspirational, But Practical
All eyes are on the largest generation of adults, Millennials. While their dream home ideals are sky-high, the approach they employ to budgets, goals, home-ownership and renovations shows their well developed practical side.
Big Bear Market Stats as of March 7th, 2017
- Total Active Residential Properties: 341 (5% decrease from February 1st)
- Total Residential Properties in Back-Up and Pending: 153 (12% increase from February 1st)
- Total Residential Properties Sold in February: 69 (17% decrease from January)
*77 properties sold in February 2016, and 74 sold in February 2015. - 83 Sold in January
108 Sold in December
117 Sold in November - New Residential Listings in February: 98 (21% increase from 77 in January)
- 11% of Current Market has been reduced in price since February 1st.
- Properties sold from January 1st 2017 to March 7th 2017: 177 (7% increase from 164 in January 2016-March 2016)
- Total Sales Volume January 1st 2017 to March 7th 2017: $56,175,137 (14% increase from $48,035,078 in January 2016-March 2016)
- « Previous Page
- 1
- …
- 33
- 34
- 35
- 36
- 37
- …
- 51
- Next Page »