Big Bear Market Statistics as of January 1st, 2024
Big Bear Market Stats as of January 1st, 2024
- Total Active Residential Properties: 276 (15% decrease from December) January 2023 reported 217
- Total Residential Properties in Back-Up and Pending: 54 (28% decrease from December)
- Total Residential Properties Sold in December: 68 (21% increase from November)
53 properties sold in December 2022, and 106 sold in December 2021. - 54 Sold in November
63 Sold in October
71 Sold in September
81 Sold in August
74 Sold in July
64 Sold in June - New Residential Listings in December: 52 (19% decrease from 64 in November)
- 17% of Current Market was reduced in price in December.
- Properties sold from January 1st 2023 to December 31st 2023: 784 (30% decrease from 1128 in January-December 2022)
- Total Sales Volume January 1st 2023 to December 31st 2023: $489,786,852 (31% decrease from $713,151,781 in January-December 2022)
Price breakdown as of January 1, 2024
$0-300,000K – 16 units – 6% of inventory
$300,001-500k – 88 units – 32% of inventory
$500,001-800k – 94 units – 34% of inventory
$800,001k plus – 78 units – 28% of inventory
Sold Jan-Dec 2023– 784 units
$0-300,000k – 69 units – 9% of sold units
$300,001-500k – 331 units – 42% of sold units
$500,001-800k – 247 units – 32% of sold units
$800,001 plus – 137 units – 17% of sold units
Big Bear Market Stats as of December 1, 2023
Big Bear Market Stats as of December 1st,2023
- Total Active Residential Properties: 327 (10% decrease from November) December 2022 reported 268
- Total Residential Properties in Back-Up and Pending: 75 (10% increase from November)
- Total Residential Properties Sold in November: 53 (16% decrease from October)
63 properties sold in November 2022, and 167 sold in November 2021. - 63 Sold in October
71 Sold in September
81 Sold in August
74 Sold in July
64 Sold in June
88 Sold in May - New Residential Listings in November: 64 (34% decrease from 97 in October)
- 22% of Current Market was reduced in price in November.
- Properties sold from January 1st 2023 to November 30th 2023: 715 (33% decrease from 1075 in January-November 2022)
- Total Sales Volume January 1st 2023 to November 30th 2023: $446,533,822 (35% decrease from $684,617,781 in January-November 2022)
Price breakdown as of December 1, 2023
$0-300,000K – 17 units – 5% of inventory
$300,001-500k – 102 units – 31% of inventory
$500,001-800k – 109 units – 34% of inventory
$800,001k plus – 99 units – 30% of inventory
Sold Jan-Nov 2023– 715 units $0-300,000k – 64 units – 9% of sold units
$300,001-500k – 297 units – 41% of sold units
$500,001-800k – 227 units – 32% of sold units
$800,001 plus – 127 units – 18% of sold units
Big Bear Market Stats as of November 1, 2023
Big Bear Market Stats as of November 1st,2023
- Total Active Residential Properties: 362 (4% decrease from October) November 2022 reported 282
- Total Residential Properties in Back-Up and Pending: 68 (9% decrease from October)
- Total Residential Properties Sold in October: 63 (11% decrease from September)
102 properties sold in October 2022, and 160 sold in October 2021. - 71 Sold in September
81 Sold in August
74 Sold in July
64 Sold in June
88 Sold in May
51 Sold in April - New Residential Listings in October: 97 (4% decrease from 101 in September)
- 27% of Current Market was reduced in price in October.
- Properties sold from January 1st 2023 to October 31st 2023: 662 (35% decrease from 1012 in January-October 2022)
- Total Sales Volume January 1st 2023 to October 31st 2023: $415,803,972 (36% decrease from $650,618,872 in January-October 2022)
Price breakdown as of November 1, 2023
$0-300,000K – 21 units – 6% of inventory
$300,001-500k – 114 units – 31% of inventory
$500,001-800k – 127 units – 35% of inventory
$800,001k plus – 100 units – 28% of inventory
Sold Jan-Oct 2023– 662 units
$0-300,000k – 60 units – 9% of sold units
$300,001-500k – 273 units – 41% of sold units
$500,001-800k – 207 units – 31% of sold units
$800,001 plus – 122 units – 19% of sold units
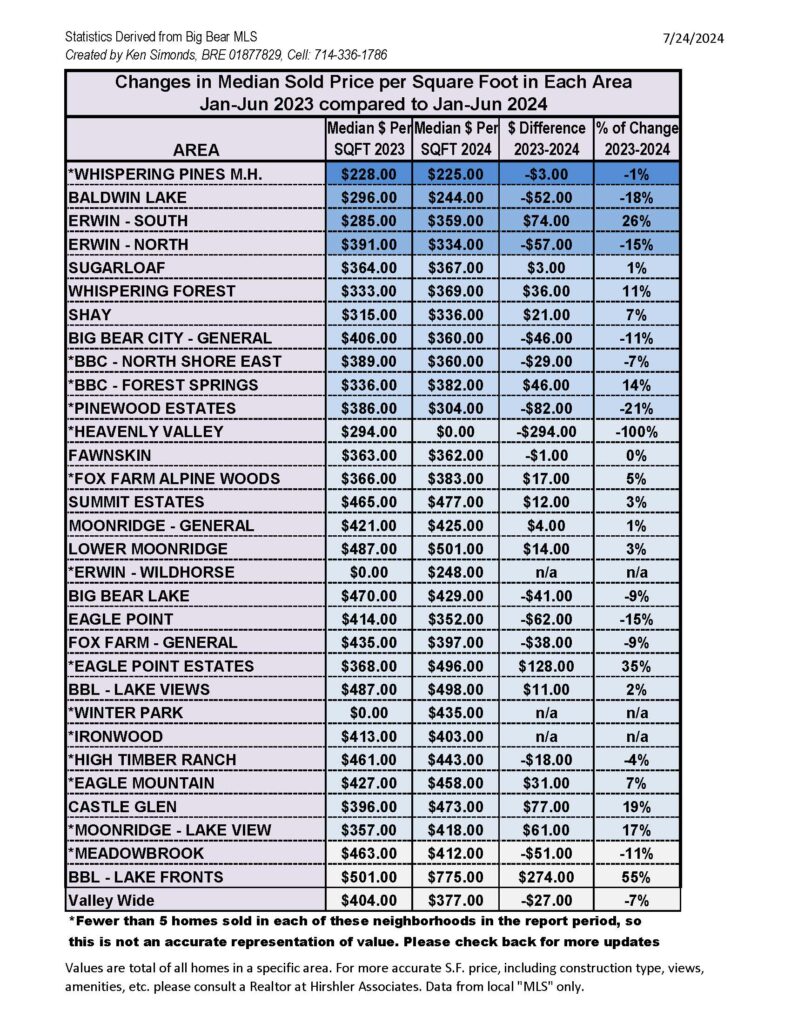
Changes in Median Sold Price per Square Foot and Units Sold in Each Area Jan-Sep 2022 compared to Jan-Sep 2023
Big Bear Market Stats as of October 1, 2023
Big Bear Market Stats as of October 1st,2023
- Total Active Residential Properties: 378 (2% increase from September) October 2022 reported 304
- Total Residential Properties in Back-Up and Pending: 75 (5% decrease from September)
- Total Residential Properties Sold in September: 71 (12% decrease from August)
113 properties sold in September 2022, and 150 sold in September 2021. - 81 Sold in August
74 Sold in July
64 Sold in June
88 Sold in May
51 Sold in April
68 Sold in March - New Residential Listings in September: 101 (11% decrease from 114 in August)
- 30% of Current Market was reduced in price in September.
- Properties sold from January 1st 2023 to September 30th 2023: 599 (34% decrease from 910 in January-September 2022)
- Total Sales Volume January 1st 2023 to September 30th 2023: $377,227,513 (37% decrease from $594,789,972 in January-September 2022)
Price breakdown as of October 1, 2023
$0-300,000K – 18 units – 5% of inventory
$300,001-500k – 117 units – 31% of inventory
$500,001-800k – 143 units – 38% of inventory
$800,001k plus – 100 units – 26% of inventory
Sold Jan-Sep 2023– 599 units
$0-300,000k – 55 units – 9% of sold units
$300,001-500k – 239 units – 40% of sold units
$500,001-800k – 196 units – 33% of sold units
$800,001 plus – 109 units – 18% of sold units
- « Previous Page
- 1
- 2
- 3
- 4
- 5
- …
- 51
- Next Page »