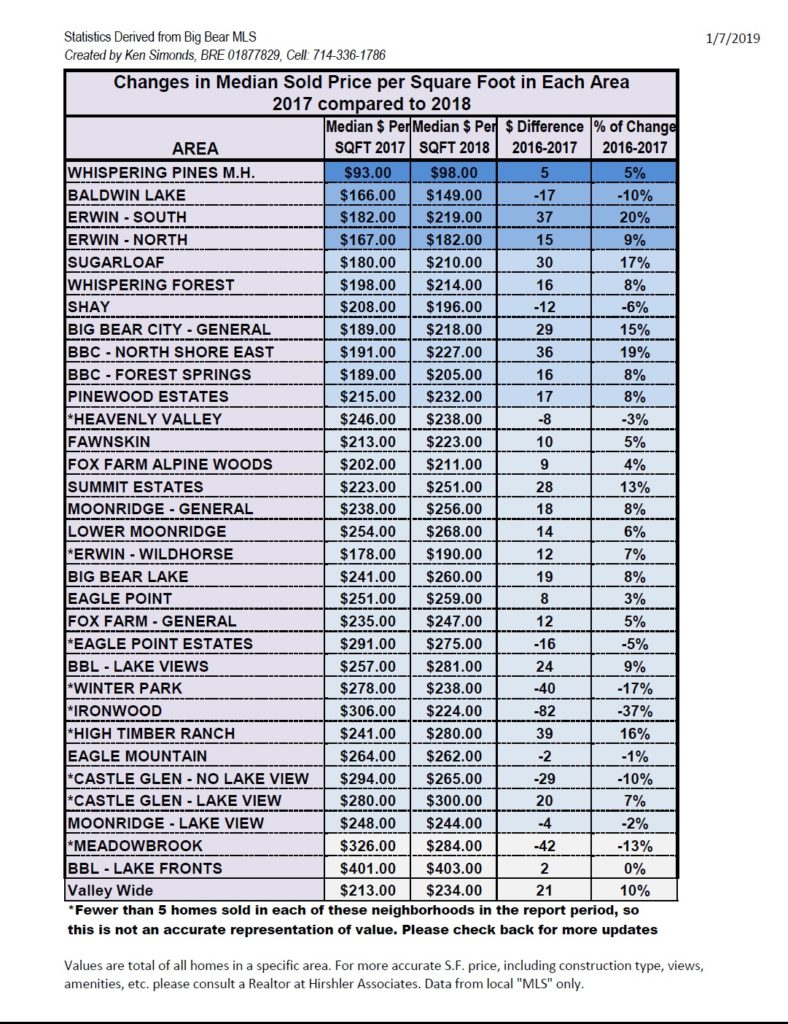
Big Bear Market Stats as of January 7, 2019
Price breakdown as of January 7, 2019
0-300K- 164 units
– 38.1% of inventory
301-500k- 117 units – 27.2% of inventory
501-800k- 67 units- 15.6% of inventory
801k and above – 82 units- 19.1% of inventory
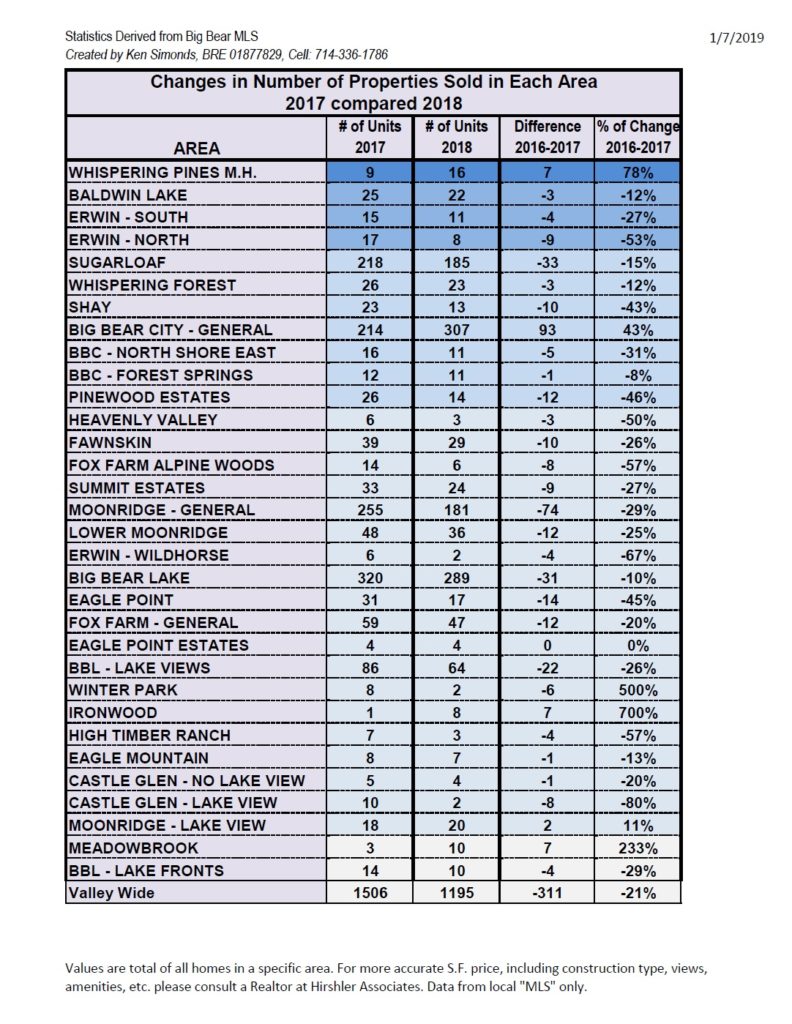
Sold 2018 – 1195 units
0-300k – 667
units- 55.8% of sold units
301-500k- 381 units- 31.9% of sold units
501-800k – 108 units – 9.0% of sold units
801k and above – 39 units 3.3% of sold units
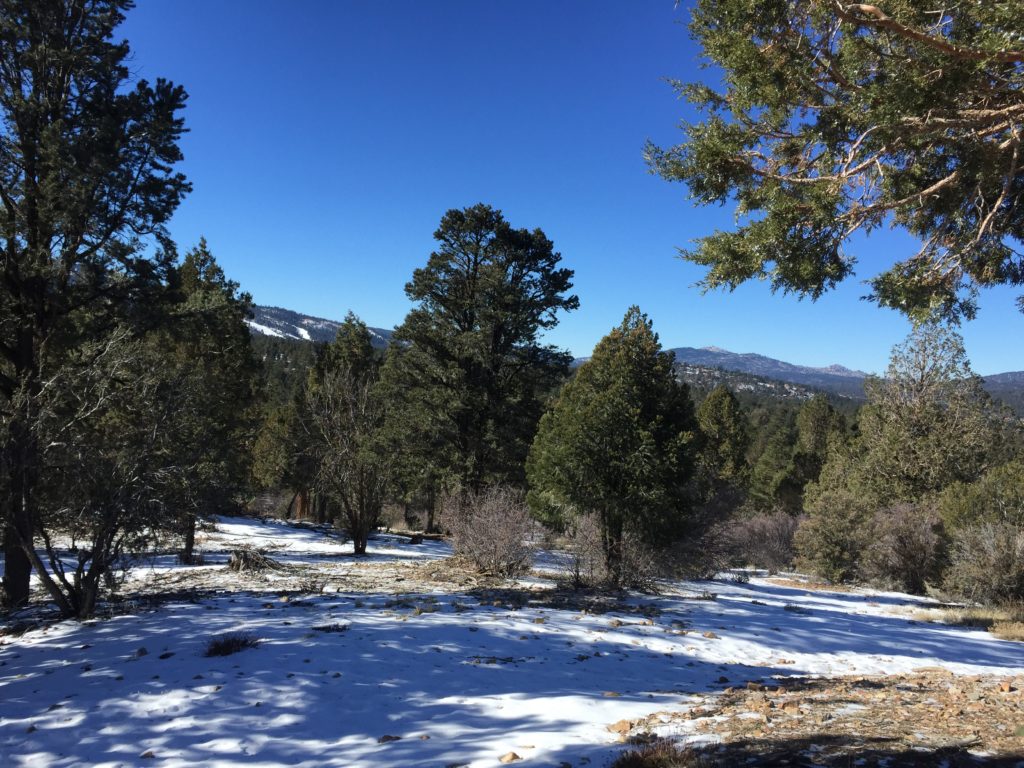
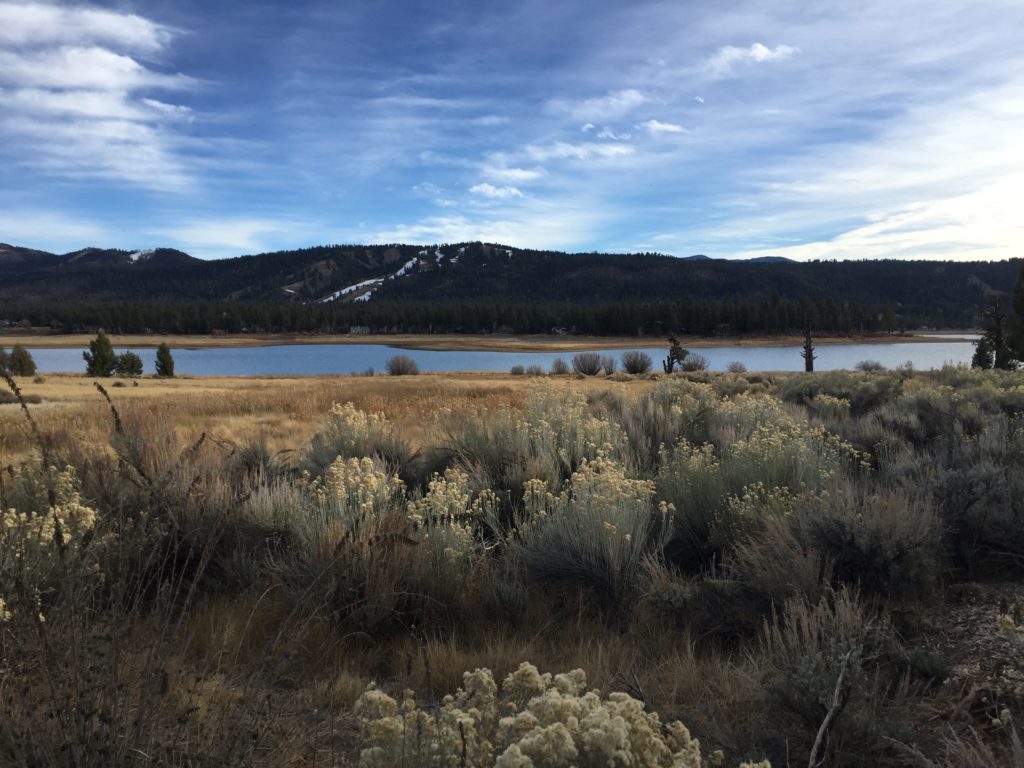 Photo Courtesy of Cathy McCabe
Big Bear Market Stats as of December 3, 2018
Price breakdown as of December 3, 2018
0-300K- 183 units – 38.6% of inventory
301-500k- 136 units – 28.7% of inventory
501-800k- 75 units- 15.8% of inventory
801k and above – 80 units- 16.9% of inventory
Sold YTD 2018 – 1113 units
0-300k – 626 units- 56.3% of sold units
301-500k- 354 units- 31.8% of sold units
501-800k – 98 units – 8.8% of sold units
801k and above – 35 units 3.1% of sold units
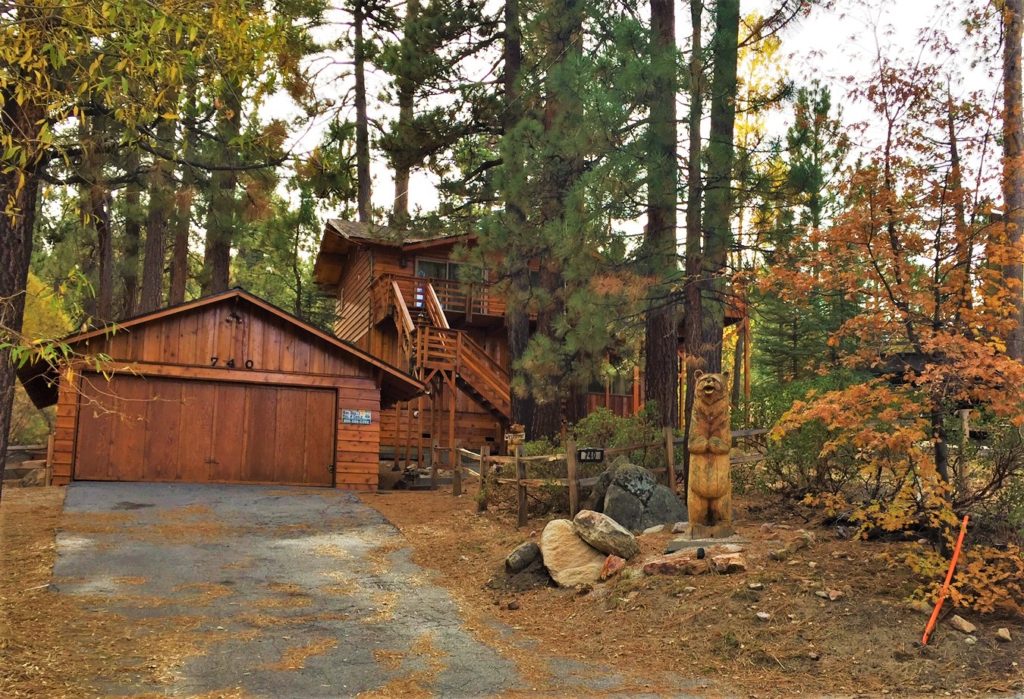 Recently sold Big Bear Lake home
Big Bear Market Stats as of November 1, 2018
Price breakdown as of November 1, 2018
0-300K- 191 units – 36.6% of inventory
301-500k- 156 units – 29.8% of inventory
501-800k- 96 units- 18.3% of inventory
801k and above – 80 units- 15.3% of inventory
Sold YTD 2018 – 1006 units
0-300k – 569 units- 56.6% of sold units
301-500k- 316 units- 31.4% of sold units
501-800k – 90 units – 8.9% of sold units
801k and above – 31 units 3.1% of sold units


