Big Bear Market Stats as of May 20th, 2025
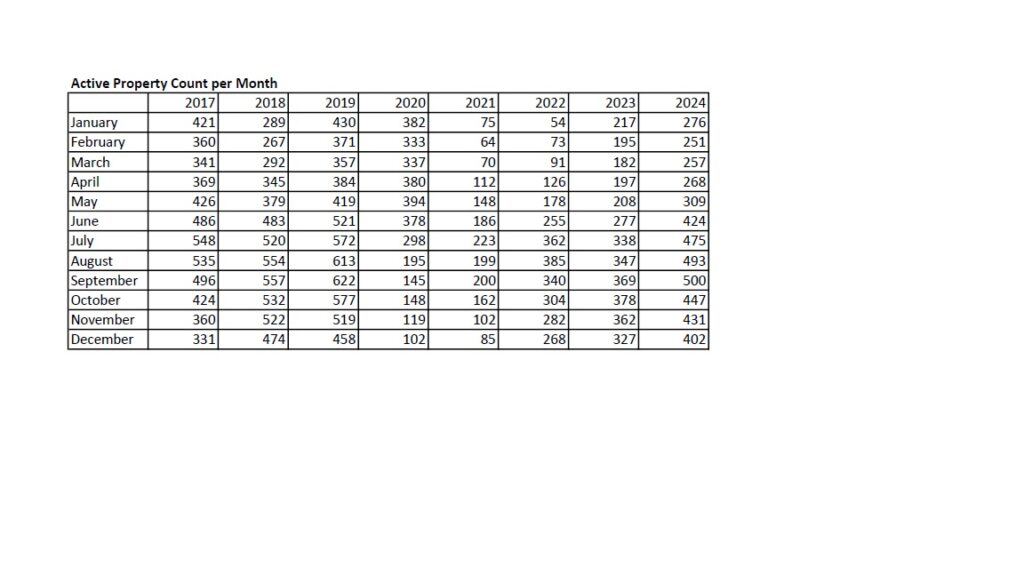
- Total Active Residential Properties: 515 (11% increase from April) May 2024 reported 309
- Total Residential Properties in Back-Up and Pending: 55 (6% decrease from April)
- Total Residential Properties Sold in April: 54 (5% increase from March)
52 properties sold in April 2023, and 75 sold in April 2024. - 51 Sold in March
51 Sold in February
64 Sold in January
82 Sold in December
73 Sold in November
62 Sold in October - New Residential Listings in April: 144 (13% increase from 128 in March)
- 13% of Current Market was reduced in price in April.
- Properties sold from January 1st 2025 to April 30th 2025: 220 (11% decrease from 247 in Jan-Feb 2024)
- Total Sales Volume January 1st 2025 to January 31st 2025: $135,296,944 (12% decrease from $152,943,064 in Jan-Feb 2024)
Price breakdown as of May 20, 2025
$0-300,000K – 25 units – 5% of inventory
$300,001-500k – 199 units – 38% of inventory
$500,001-800k – 175 units – 34% of inventory
$800,001k plus – 119 units – 23% of inventory
Sold Jan-Apr 2025– 220 units
$0-300,000k – 31 units – 14% of sold units
$300,001-500k – 75 units – 34% of sold units
$500,001-800k – 79 units – 36% of sold units
$800,001 plus – 35 units – 16% of sold units