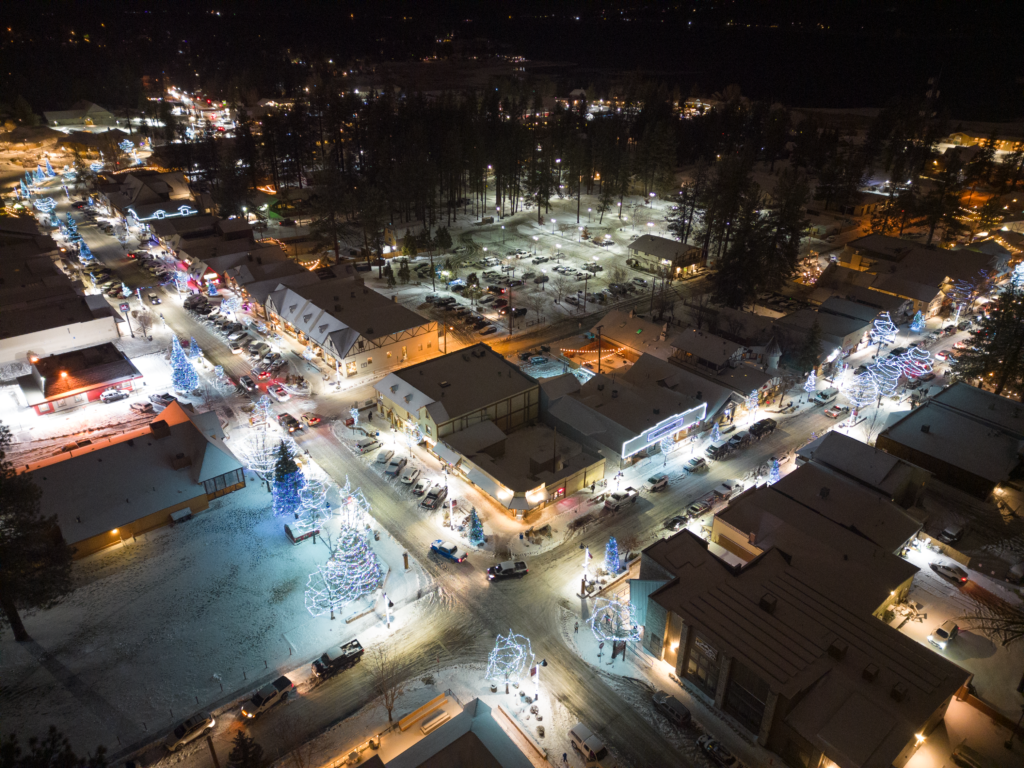
Big Bear Market Stats as of October 1st, 2022
- Total Active Residential Properties: 304 (11% decrease from September) October 2021 reported 162
- Total Residential Properties in Back-Up and Pending: 106 (21% decrease from September)
- Total Residential Properties Sold in September: 107 (16% increase from August)
150 properties sold in September 2021, and 270 sold in September 2020. - 92 Sold in August
66 Sold in July
104 Sold in June
117 Sold in April
132 Sold in March
77 Sold in February - New Residential Listings in September: 91 (17% decrease from 109 in August)
- 33% of Current Market was reduced in price in September.
- Properties sold from January 1st 2022 to September 30th 2022: 899 (32% decrease from 1320 in January-September 2021)
- Total Sales Volume January 1st 2022 to September 30th 2022: $589,373,972 (18% decrease from $724,196,519 in January-September 2021)
Price breakdown as of September 7, 2022
$0-300,000K – 14 units – 5% of inventory
$300,001-500k – 104 units – 34% of inventory
$500,001-800k – 105 units – 35% of inventory
$800,001k plus – 81 units – 26% of inventory
Sold Jan-Sep 2022– 899 units
$0-300,000k – 62 units – 7% of sold units
$300,001-500k – 329 units – 36% of sold units
$500,001-800k – 330 units – 37% of sold units
$800,001 plus – 178 units – 20% of sold units
Big Bear Market Stats as of September 7th, 2022
Big Bear Market Stats as of September 7th,2022
- Total Active Residential Properties: 340 (12% decrease from August) September 2021 reported 200
- Total Residential Properties in Back-Up and Pending: 134 (38% increase from August)
- Total Residential Properties Sold in August: 92 (39% increase from July)
170 properties sold in August 2021, and 237 sold in August 2020. - 66 Sold in July
104 Sold in June
117 Sold in April
132 Sold in March
77 Sold in February
91 Sold in January - New Residential Listings in August: 109 (18% decrease from 133 in July)
- 21% of Current Market was reduced in price in August.
- Properties sold from January 1st 2022 to August 31st 2022: 791 (32% decrease from 1170 in January-August 2021)
- Total Sales Volume January 1st 2022 to August 31st 2022: $527,235,567 (17% decrease from $634,826,650 in January-July 2021)
Price breakdown as of September 7, 2022
$0-300,000K – 18 units – 5% of inventory
$300,001-500k – 114 units – 34% of inventory
$500,001-800k – 122 units – 36% of inventory
$800,001k plus – 86 units – 25% of inventory
Sold Jan-Aug 2022– 791 units
$0-300,000k – 46 units – 6% of sold units
$300,001-500k – 284 units – 36% of sold units
$500,001-800k – 297 units – 38% of sold units
$800,001 plus – 164 units – 20% of sold units
Big Bear Market Stats as of August 1st, 2022
Big Bear Market Stats as of August 1st,2022
- Total Active Residential Properties: 385 (7% increase from July) August 2021 reported 199
- Total Residential Properties in Back-Up and Pending: 97 (9% increase from July)
- Total Residential Properties Sold in July: 66 (37% decrease from June)
141 properties sold in July 2021, and 211 sold in July 2020. - 104 Sold in June
117 Sold in April
132 Sold in March
77 Sold in February
91 Sold in January
106 sold in December - New Residential Listings in July: 133 (24% decrease from 175 in June)
- 32% of Current Market was reduced in price in July.
- Properties sold from January 1st 2022 to July 31st 2022: 698 (30% decrease from 1000 in January-July 2021)
- Total Sales Volume January 1st 2022 to July 31st 2022: $461,500,692 (15% decrease from $540,514,732 in January-July 2021)
Price breakdown as of August 1, 2022
$0-300,000K – 16 units – 4% of inventory
$300,001-500k – 152 units – 39% of inventory
$500,001-800k – 125 units – 33% of inventory
$800,001k plus – 92 units – 24% of inventory
Sold Jan-Jul 2022– 698 units
$0-300,000k – 41 units – 6% of sold units
$300,001-500k – 241 units – 35% of sold units
$500,001-800k – 270 units – 38% of sold units
$800,001 plus – 146 units – 21% of sold units
422 Chickadee Drive, Big Bear Lake, CA 92315
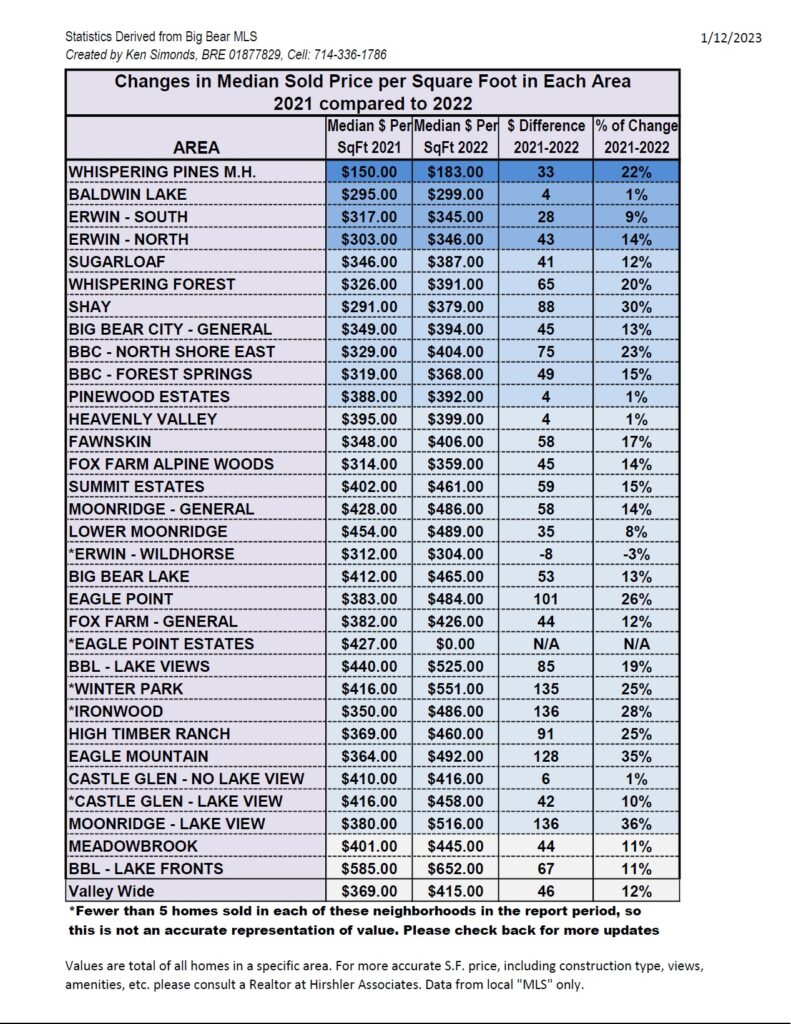
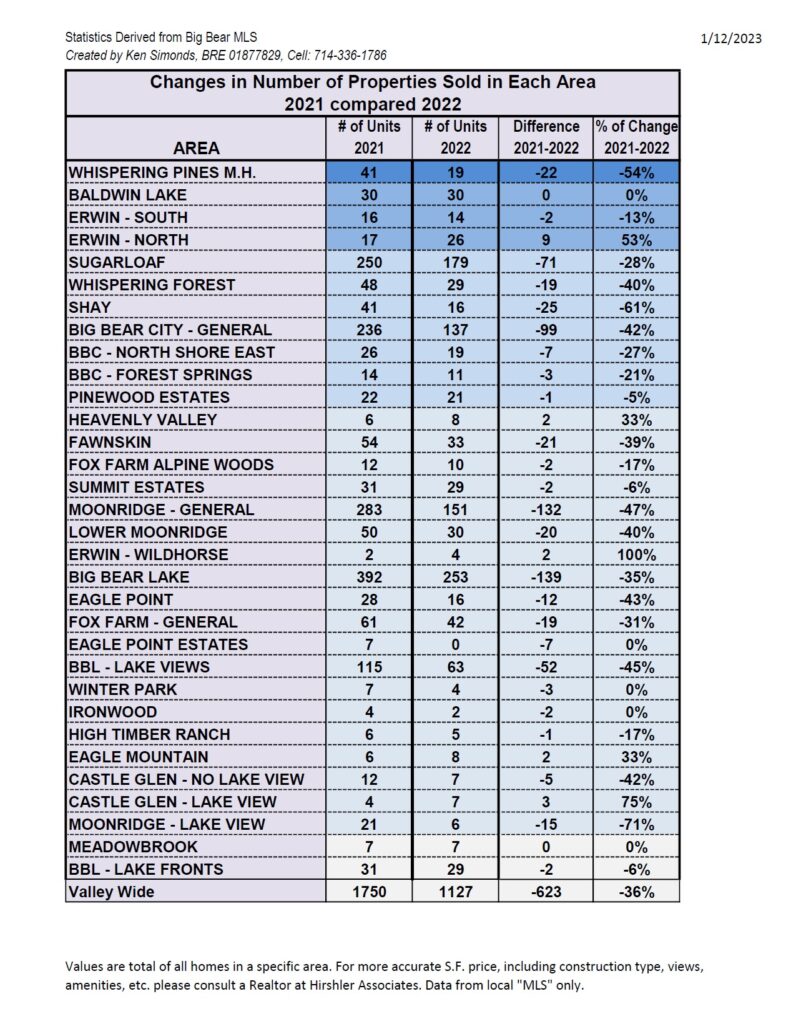
Changes in Median Sold Price per Square Foot and Units Sold in Each Area Jan-Jun 2021 compared to Jan-Jun 2022
- « Previous Page
- 1
- …
- 5
- 6
- 7
- 8
- 9
- …
- 49
- Next Page »