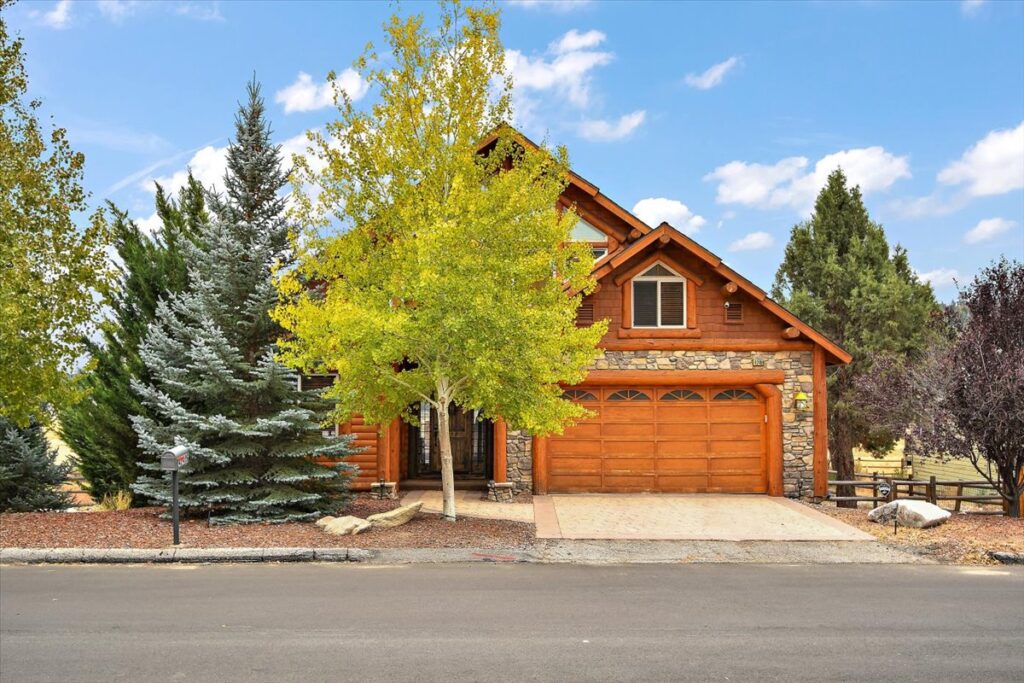
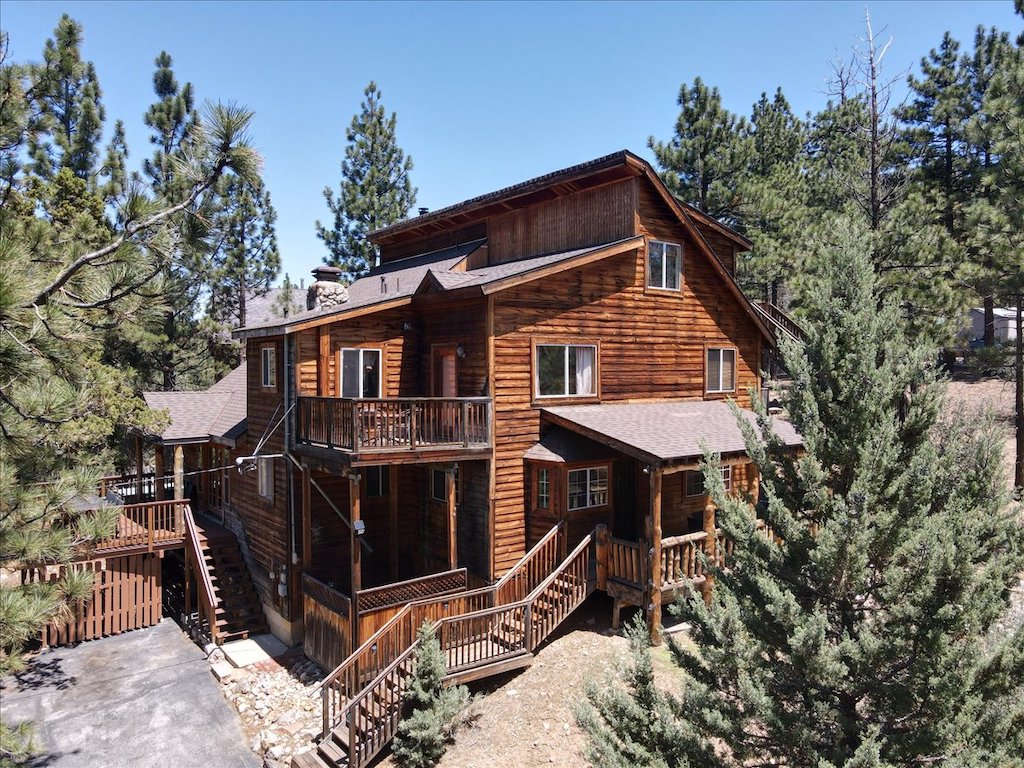
Charming and cozy single-story cabin located in Moonridge is close to everything! This 2-bedroom, 1-bath, home with open beamed T&G ceilings, wood stove insert in native rock fireplace, cozy mountain décor & furnishings, warm wood paneling, vintage fully equipped kitchen, separate laundry room, dual pane windows, composite wood flooring, remodeled bath & 2 main level bedrooms w/ample closet space is only 2 blocks from the winter ski shuttle to Bear Mountain Resort and trolley line stop, the new Big Bear Alpine Zoo & local coffee/donut shops. Also located less than 2-mi. to Snow Summit Resort & 3 mi. to downtown Big Bear ‘Village’ for shopping/dining/entertainment. Well maintained property with parking area for 4-vehicles or RV/Boat parking, showing pride of ownership, with a large, partially fenced backyard and storage bldg. Audio/Video Surveillance, drip landscape system. Would make a cozy full or part-time home or investment property.
Big Bear Market Stats as of November 2nd, 2021

Big Bear Market Stats as of November 2nd, 2021
- Total Active Residential Properties: 102 (37% decrease from October)
November 2020 reported 119 - Total Residential Properties in Back-Up and Pending: 191 (9% decrease from September)
- Total Residential Properties Sold in October: 158 (6% increase from September)
207 properties sold in September 2020, and 148 sold in September 2019. - 149 Sold in September
165 Sold in August
137 Sold in July
175 Sold in June
143 Sold in May
150 Sold in April
138 Sold in March - New Residential Listings in October: 122 (11% decrease from 137 in September)
- 18% of Current Market was reduced in price in October.
- Properties sold from January 1st 2021 to October 31st 2021: 1474 (2% increase from 1443 in January 2020 to October 2020)
- Total Sales Volume January 1st 2021 to October 31st 2021: $812,132,064 (26% increase from $646,244,357 in January 2020 to October 2020)
Price breakdown as of November 2, 2021
$0-300,000K – 5 units – 5% of inventory
$300,001-500k – 26 units – 25% of inventory
$500,001-800k – 30 units – 29% of inventory
$800,001k plus – 41 units – 30% of inventory
Sold Jan-Oct 2021 – 1474 units
$0-300,000k – 217 units – 15% of sold units
$300,001-500k – 630 units – 43% of sold units
$500,001-800k – 436 units – 29% of sold units
$800,001 plus – 191 units – 13% of sold units
42489 Bear Loop, Big Bear City, CA 92314
Exquisite and charming Log Style Custom Home that backs up to Baker’s Pond and checks all the boxes with incredible Lake and Mountain views at wall of windows. Attention to detail w/extensive use of tiger striped logs and T&G throughout, vaulted beamed ceilings. Featuring Smart home technology w/remote lighting, central heating and A/C, and surveillance via cell phone. Whole house intercom, central vacuum, alarm system and 50-A/220-V (Tesla) outlet. SS Appliances. Main Floor Master Bedroom with ensuite full bath. Tastefully decorated w/high end mountain themed furnishings. Enjoy the views with your morning coffee on the large low maintenance deck. Spa is off deck. Fenced backyard & Oversized attached 2-Car Garage. Southern exposure. This must-see property will not disappoint. Great opportunity as full-time home to live/work from, second home or investment property. Great location near the Lake, 2.9 miles to Snow Summit, and 3.9 miles to the Village for dining and entertainment.
Click here for more info, including floorplans, digital walk-through, and more photos.
Recently Sold Properties
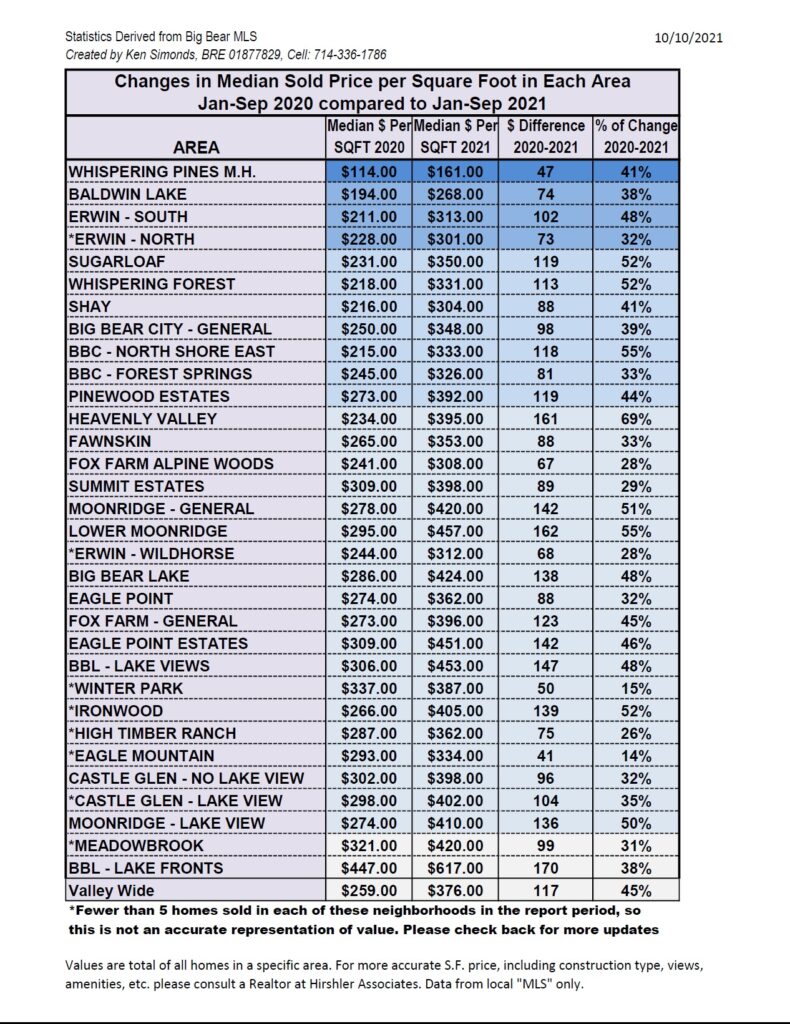
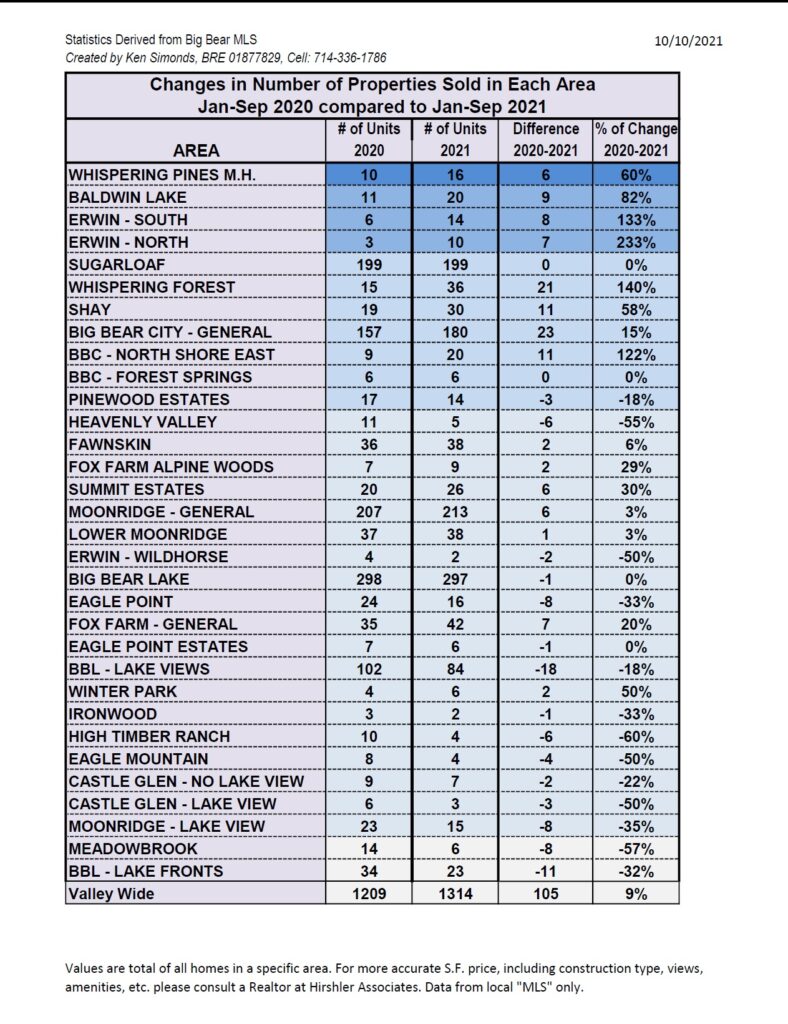
Changes in Median Sold Price per Square Foot and Units Sold Jan-Sep 2020 compared to Jan-Sep 2021


Big Bear Market Statistics as of October 1st, 2021

Big Bear Market Stats as of October 1st, 2021
- Total Active Residential Properties: 162 (19% decrease from September)
October 2020 reported 148 - Total Residential Properties in Back-Up and Pending: 210 (9% increase from September)
- Total Residential Properties Sold in September: 149 (10% decrease from August)
270 properties sold in September 2020, and 112 sold in September 2019. - 165 Sold in August
137 Sold in July
175 Sold in June
143 Sold in May
150 Sold in April
138 Sold in March - New Residential Listings in September: 137 (13% decrease from 157 in August)
- 19% of Current Market was reduced in price in September.
- Properties sold from January 1st 2021 to September 30th 2021: 1314 (6% increase from 1236 in January 2020 to September 2020)
- Total Sales Volume January 1st 2021 to September 30th 2021: $719,771,519 (34% increase from $535,965,701 in January 2020 to September 2020)
Price breakdown as of October 1, 2021
$0-300,000K – 10 units – 6% of inventory
$300,001-500k – 60 units – 37% of inventory
$500,001-800k – 52 units – 32% of inventory
$800,001k plus – 40 units – 25% of inventory
Sold Jan-Sep 2021 – 1314 units
$0-300,000k – 195 units – 15% of sold units
$300,001-500k – 572 units – 44% of sold units
$500,001-800k – 382 units – 29% of sold units
$800,001 plus – 165 units – 12% of sold units
- « Previous Page
- 1
- …
- 10
- 11
- 12
- 13
- 14
- …
- 50
- Next Page »
