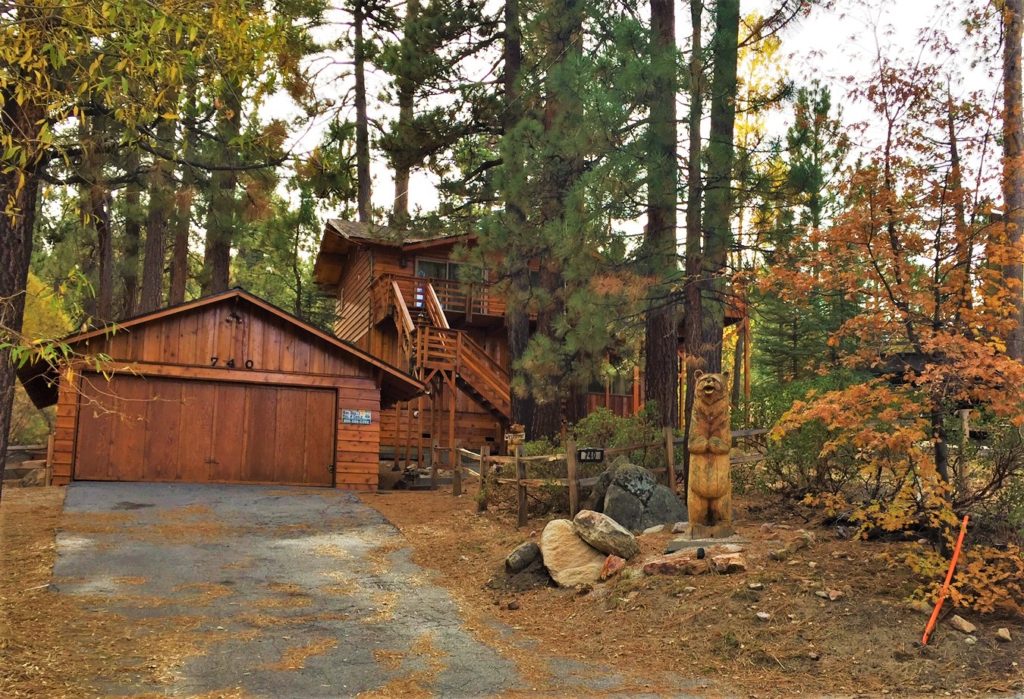
 Recently sold Big Bear Lake home
Big Bear Market Stats as of November 1, 2018
- Total Active Residential Properties: 522 (2% decrease from October)
November 2017 reported 360 - Total Residential Properties in Back-Up and Pending: 135 (18% decrease from October)
- Total Residential Properties Sold in October: 122 (3% increase from September)
*170 properties sold in October 2017, and 128 sold in October 2016. - 118 Sold in September
122 Sold in August
97 Sold in July
100 Sold in June
110 Sold in May
78 Sold in April
96 Sold in March - New Residential Listings in October: 140 (12% decrease from 159 in September)
- 24% of Current Market has been reduced in price in October.
- Properties sold from January 1st 2018 to October 31st 2018: 1006 (19% decrease from 1238 in January-October 2017)
- Total Sales Volume January 1st 2018 to October 31st 2018: $335,436,922 (15% decrease from $396,220,970 in January-October 2017)
Price breakdown as of November 1, 2018
0-300K- 191 units – 36.6% of inventory
301-500k- 156 units – 29.8% of inventory
501-800k- 96 units- 18.3% of inventory
801k and above – 80 units- 15.3% of inventory
Sold YTD 2018 – 1006 units
0-300k – 569 units- 56.6% of sold units
301-500k- 316 units- 31.4% of sold units
501-800k – 90 units – 8.9% of sold units
801k and above – 31 units 3.1% of sold units
