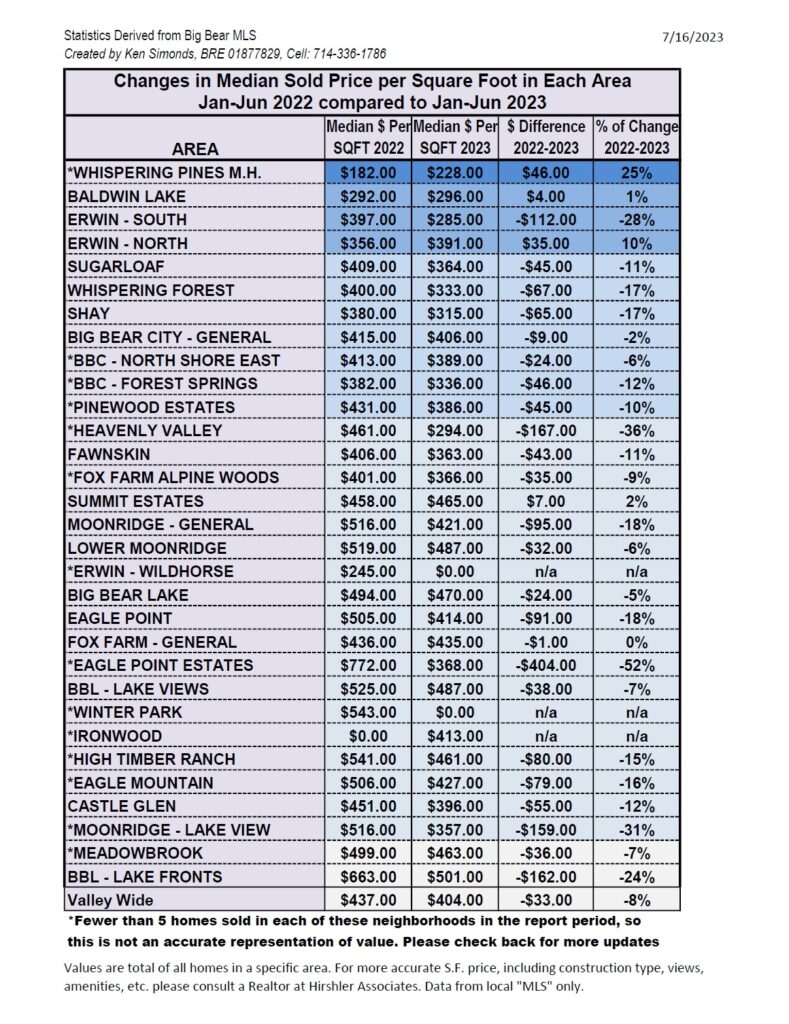

Big Bear Market Statistics as of July 3rd, 2023
Big Bear Market Stats as of July 3rd, 2023
- Total Active Residential Properties: 338 (22% increase from June) July 2022 reported 362
- Total Residential Properties in Back-Up and Pending: 80 (21% increase from June)
- Total Residential Properties Sold in June: 64 (27% decrease from May)
101 properties sold in June 2022, and 176 sold in June 2021. - 88 Sold in May
51 Sold in April
68 Sold in March
53 Sold in February
51 Sold in January
52 Sold in December - New Residential Listings in June: 136 (2% decrease from 139 in May)
- 25% of Current Market was reduced in price in June.
- Properties sold from January 1st 2023 to June 30th 2023: 369 (42% decrease from 635 in January-June 2022)
- Total Sales Volume January 1st 2023 to June 30th 2023: $229,375,978 (45% decrease from $421,609,892 in January-June 2022)
Price breakdown as of July 3, 2023
$0-300,000K – 18 units – 5% of inventory
$300,001-500k – 113 units – 33% of inventory
$500,001-800k – 114 units – 34% of inventory
$800,001k plus – 93 units – 28% of inventory
Sold Jan-June 2023– 369 units $0-300,000k – 37 units – 10% of sold units
$300,001-500k – 147 units – 40% of sold units
$500,001-800k – 123 units – 33% of sold units
$800,001 plus – 62 units – 17% of sold units
Share this:

Big Bear Market Stats as of June 1st, 2023

Big Bear Market Stats as of June 1st,2023
- Total Active Residential Properties: 277 (33% increase from May) June 2022 reported 255
- Total Residential Properties in Back-Up and Pending: 66 (26% decrease from May)
- Total Residential Properties Sold in May: 88 (57% increase from April)
106 properties sold in May 2022, and 151 sold in May 2021. - 51 sold in April
68 Sold in March
53 Sold in February
51 Sold in January
52 Sold in December
62 Sold in November - New Residential Listings in May: 139 (22% increase from 114 in April)
- 22% of Current Market was reduced in price in May.
- Properties sold from January 1st 2023 to May 31st 2023: 305 (43% decrease from 534 in January-May 2022)
- Total Sales Volume January 1st 2023 to May 31st 2023: $193,100,091 (45% decrease from $356,131,837 in January-May 2022)
Price breakdown as of June 1, 2023
$0-300,000K – 15 units – 5% of inventory
$300,001-500k – 87 units – 31% of inventory
$500,001-800k – 100 units – 36% of inventory
$800,001k plus – 75 units – 37% of inventory
Sold Jan-May 2023– 305 units
$0-300,000k – 30 units – 10% of sold units
$300,001-500k – 122 units – 40% of sold units
$500,001-800k – 100 units – 33% of sold units
$800,001 plus – 53 units – 17% of sold units
Share this:

Big Bear Market Stats as of May 2nd, 2023
Big Bear Market Stats as of May 2nd,2023
- Total Active Residential Properties: 208 (5% increase from April) May 2022 reported 178
- Total Residential Properties in Back-Up and Pending: 90 (8% increase from April)
- Total Residential Properties Sold in April: 51 (25% decrease from March)
119 properties sold in April 2022, and 151 sold in April 2021. - 68 Sold in March
53 Sold in February
51 Sold in January
52 Sold in December
62 Sold in November
103 Sold in October - New Residential Listings in April: 114 (70% increase from 67 in March)
- 18% of Current Market was reduced in price in April.
- Properties sold from January 1st 2023 to April 30th 2023: 225 (47% decrease from 428 in January-April 2022)
- Total Sales Volume January 1st 2023 to April 30th 2023: $145,873,442 (50% decrease from $289,115,897 in January-April 2022)
Price breakdown as of May 2, 2023
$0-300,000K – 14 units – 7% of inventory
$300,001-500k – 63 units – 30% of inventory
$500,001-800k – 69 units – 33% of inventory
$800,001k plus – 62 units – 30% of inventory
Sold Jan-Apr 2023– 225 units
$0-300,000k – 24 units – 11% of sold units
$300,001-500k – 90 units – 40% of sold units
$500,001-800k – 68 units – 30% of sold units
$800,001 plus – 43 units – 19% of sold units
Share this:

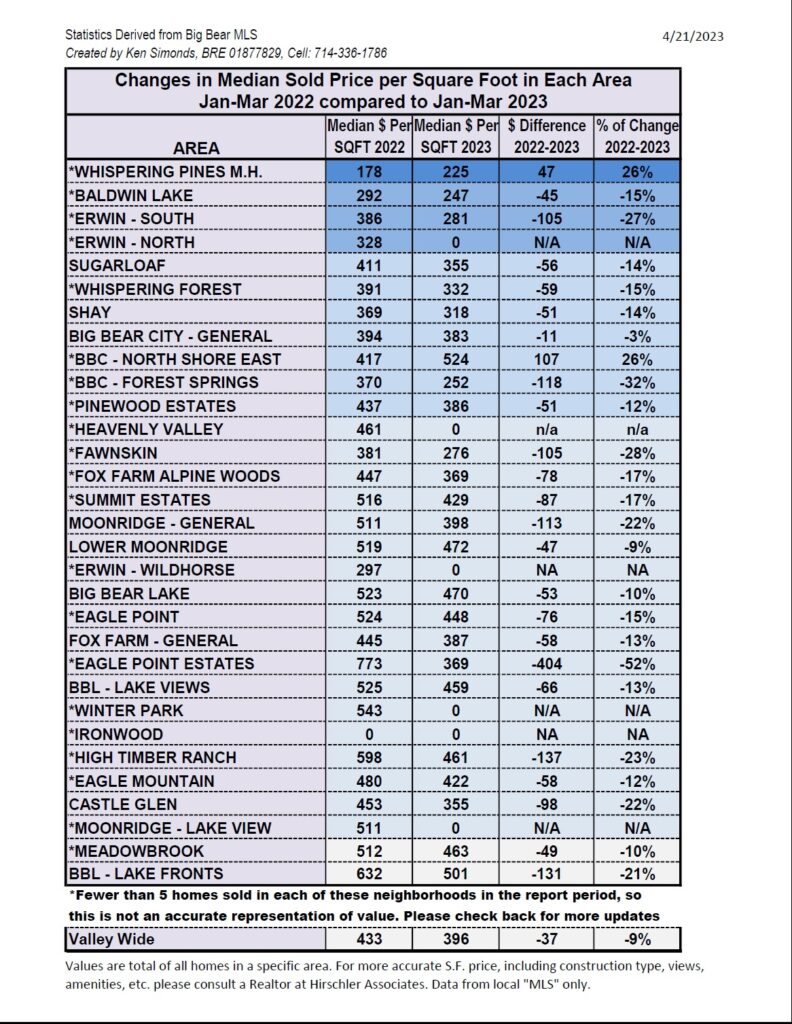
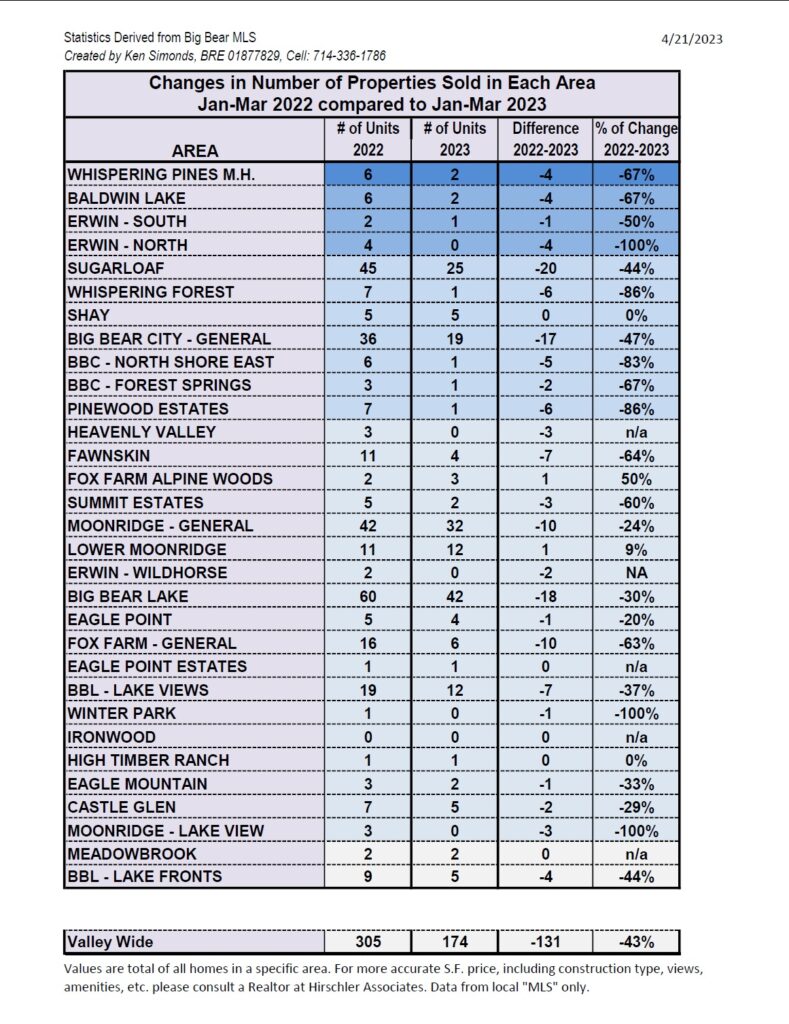
Changes in Median Sold Price per Square Foot and Units Sold in Each Area Jan-Mar 2022 compared to Jan-Mar 2023

Big Bear Market Stats as of March 1st, 2023

Big Bear Market Stats as of March 1st,2023
- Total Active Residential Properties: 182 (6% decrease from February) March 2022 reported 91
- Total Residential Properties in Back-Up and Pending: 89 (10% increase from February)
- Total Residential Properties Sold in February: 53 (4% increase from January)
80 properties sold in February 2022, and 103 sold in February 2021. - 51 Sold in January
52 Sold in December
62 Sold in November
103 Sold in October
107 Sold in September
92 Sold in August - New Residential Listings in February: 57 (3% increase from 55 in January)
- 18% of Current Market was reduced in price in February.
- Properties sold from January 1st 2023 to February 28th 2023: 103 (42% decrease from 177 in January-February 2022)
- Total Sales Volume January 1st 2023 to February 28th 2023: $62,543,942 (48% decrease from $120,813,558 in January-February 2022)
Price breakdown as of March 1, 2023
$0-300,000K – 20 units – 11% of inventory
$300,001-500k – 53 units – 29% of inventory
$500,001-800k – 58 units – 32% of inventory
$800,001k plus – 51 units – 28% of inventory
Sold Jan-Feb 2023– 103 units
$0-300,000k – 8 units – 8% of sold units
$300,001-500k – 46 units – 45% of sold units
$500,001-800k – 32 units – 31% of sold units
$800,001 plus – 17 units – 16% of sold units
Share this:

- « Previous Page
- 1
- …
- 4
- 5
- 6
- 7
- 8
- …
- 52
- Next Page »