Time to Sell?
Are you ready to sell?
Changes in Median Price per Square Foot and Number of Properties Sold Jan-June 2015 Compared to Jan-June 2016
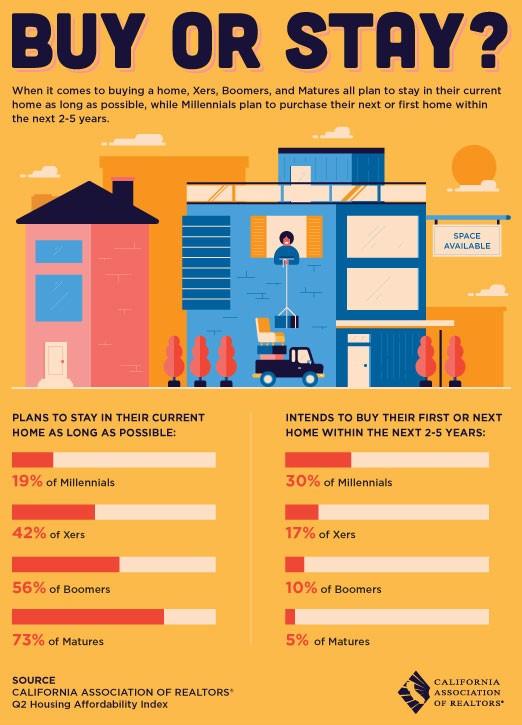
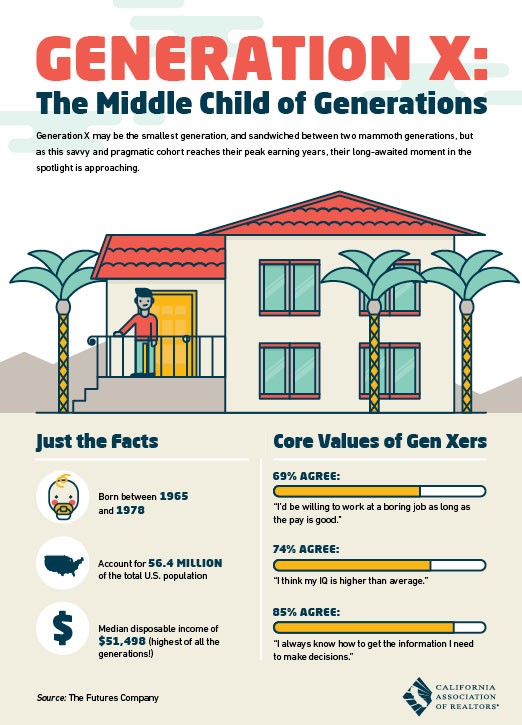
Centennials-The Newest Generation Entering the Economy
The striation between the generations used to just consider the Millenials and Boomers, with Gen X’ers thrown in from time to time. Now that ‘Centennials’ are on the scene, what could that mean for the economy?
Schools Rule!
In Big Bear, we only have one school district, but for full-time residents, many parents are concerned with which elementary school their children attend, as there are 3 in our area.
Are schools a big influence in the housing decisions you make?
Big Bear Market Statistics August 1st
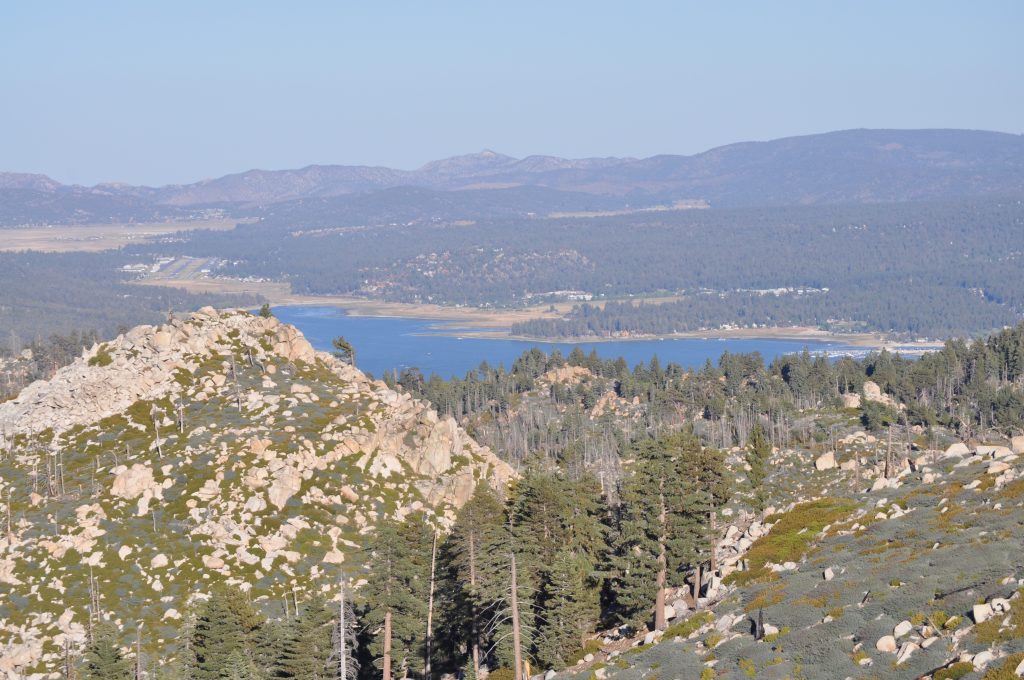
Photo courtesy of Khalsaweb
Big Bear Market Statistics as of August 1st, 2016
- Total Active Residential Properties: 618 (1% increase from June 1st)
- Total Residential Properties in Back-Up and Pending: 175 (2% increase from June 1st)
- Total Residential Properties Sold in July: 95 (2% decrease from June) (Down slightly from the past 2 years*)
*The number of properties sold in July 2015 was 113. In July 2014, 104 sold. - 97 sold in June
86 sold in May
83 sold in April
114 sold in March
70 sold in February
65 Sold in January - New Residential Listings in July: 166 (7% decrease from June, the same as July 2015)
- 21% of Current Market has been reduced in price since June 1st.
- Properties sold from January 1st 2016 to August 1st 2016: 634 (3% decrease from January 2015-August 2015)
- Total Sales Volume January 1st 2016 to July 1st 2016: $190,971,500 (6% increase from January 2015-August 2015)
- « Previous Page
- 1
- …
- 39
- 40
- 41
- 42
- 43
- …
- 51
- Next Page »