Do older people know something Millennials don’t? Will fortune favor the bold? We’ll just have to wait and see.
9 Habits for a Home That Always Feels Neat and Fresh
We found some useful tips to help keep your home tidy and comfortable. This graph is from houselogic.com, a site that has tons of practical tips for homeowners.
Market Stats for Big Bear Lake as of October 3rd, 2016
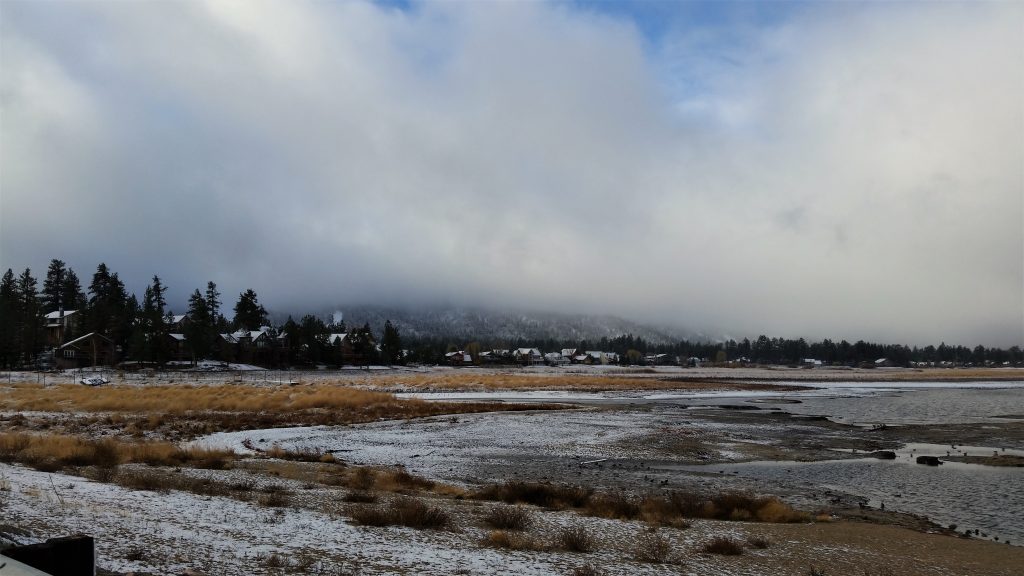
Photo Courtesy of Cathy McCabe
Big Bear Market Stats as of October 3rd, 2016
- Total Active Residential Properties: 528 (13% decrease from September 2nd)
- Total Residential Properties in Back-Up and Pending: 205 (4% increase from September 2nd)
- Total Residential Properties Sold in September: 119 (15% increase from August)
*120 properties sold in September 2015, and 116 sold in September 2014. - 101 sold in August
99 sold in July
97 sold in June
86 sold in May
83 sold in April
114 sold in March - New Residential Listings in September: 104 (31% decrease from 150 in August, compared to a 2% drop from August 2015 to September 2015)
- 22% of Current Market has been reduced in price since September 2nd.
- Properties sold from January 1st2016 to October 3rd 2016: 858 (5% decrease from January 2015-October 2015)
- Total Sales Volume January 1st2016 to October 3rdt 2016: $259,251,923 (2% increase from January 2015-October 2015)
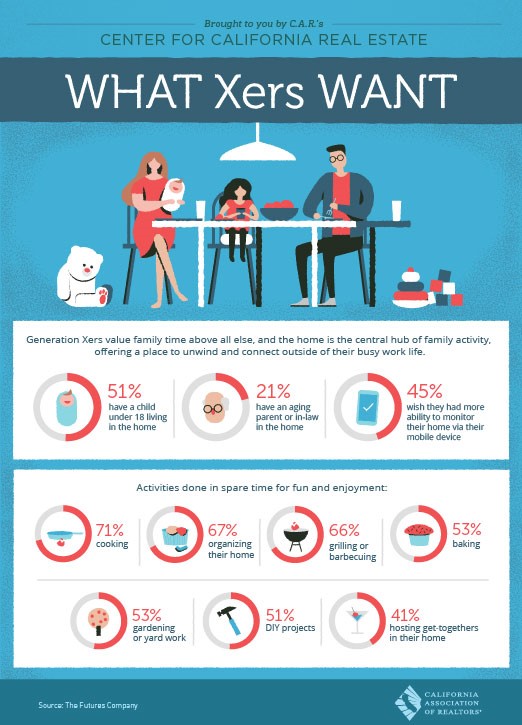
Generation X: The Middle Child of Generations
Boomers on the Hunt
Boomers are large part of the Big Bear Community. It’s important for us to keep an eye on what they want.
Big Bear Market Stats as of September 2nd, 2016
Big Bear Market Stats as of September 2, 2016
- Total Active Residential Properties: 608 (2% decrease from August 1st)
- Total Residential Properties in Back-Up and Pending: 195 (10% increase from August 1st)
- Total Residential Properties Sold in August: 101 (5% increase from July) (Down slightly from the past 2 years*)
*The number of properties sold in August 2015 was 118. In August 2014, 109 sold.
99 sold in July
97 sold in June
86 sold in May
83 sold in April
114 sold in March
70 sold in February - New Residential Listings in August: 150 (10% decrease from July, compared to a 34% drop from July 2015 to August 2015)
- 26% of Current Market has been reduced in price since August 1st.
- Properties sold from January 1st2016 to September 2nd 2016: 740 (4% decrease from January 2015-September 2015)
- Total Sales Volume January 1st2016 to September 2nd 2016: $224,048,473 (5% increase from January 2015-September 2015)
- « Previous Page
- 1
- …
- 38
- 39
- 40
- 41
- 42
- …
- 51
- Next Page »