Big Bear Market Stats as of May 2nd, 2017
New listing at 224 Echo Hill, Big Bear Lake, CA 92315
Big Bear Market Stats as of May 2nd, 2017
- Total Active Residential Properties:426 (13% increase from April 3rd)
- Total Residential Properties in Back-Up and Pending:164 (9% increase from April 3rd)
- Total Residential Properties Sold in April:95 (13% decrease from March)
*85 properties sold in April 2016, and 99 sold in April 2015. - 109 Sold in March
73 Sold in February
83 Sold in January
108 Sold in December
117 Sold in November - New Residential Listings in April:167 (3% increase from 173 in March)
- 12% of Current Market has been reduced in price since April 1st.
- Properties sold from January 1st 2017 to May 2nd 2017: 370 (7% increase from 344 in January 2016-May 2016)
- Total Sales Volume January 1st 2017 to May 2nd 2017: $113,965,813 (11% increase from $101,373,874 in January 2016-May 2016)
Median Sold Price and Sold Units January to March 2017 compared to 2016
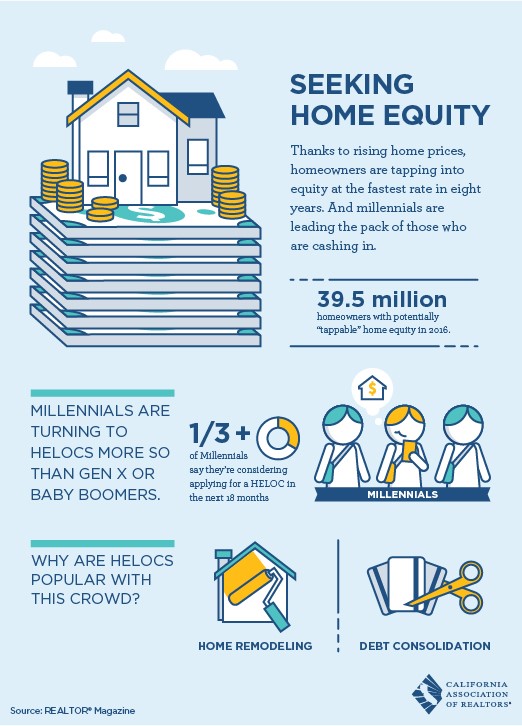
Staying Put!
Millennials are moving less frequently than older generations were at their age. Of the ones who are, even fewer are moving into their own homes.
Big Bear Market Stats as of April 3rd, 2016
Big Bear Market Stats as of April 3rd, 2017
- Total Active Residential Properties: 369 (8% increase from March 7th)
- Total Residential Properties in Back-Up and Pending: 150 (2% decrease from March 7th)
- Total Residential Properties Sold in March: 108 (36% increase from February)
*115 properties sold in March 2016, and 93 sold in March 2015. - 69 Sold in February
83 Sold in January
108 Sold in December
117 Sold in November - New Residential Listings in March: 170 (42% increase from 98 in February)
- 12% of Current Market has been reduced in price since March 1st.
- Properties sold from January 1st 2017 to April 3rd 2017: 277 (4% increase from 265 in January 2016-April 2016)
- Total Sales Volume January 1st 2017 to April 3rd 2017: $87,557,474 (8% increase from $80,255,818 in January 2016-April 2016)
Mortgage Mayhem
Since the mid-2000’s, homeownership has dropped. This is in part due to denial of mortgages. It is interesting to see what percentage of applicants in different racial groups have been denied, and why. Most applicants across the board are denied mortgages due to a too-high debt to income ratio.
- « Previous Page
- 1
- …
- 33
- 34
- 35
- 36
- 37
- …
- 51
- Next Page »