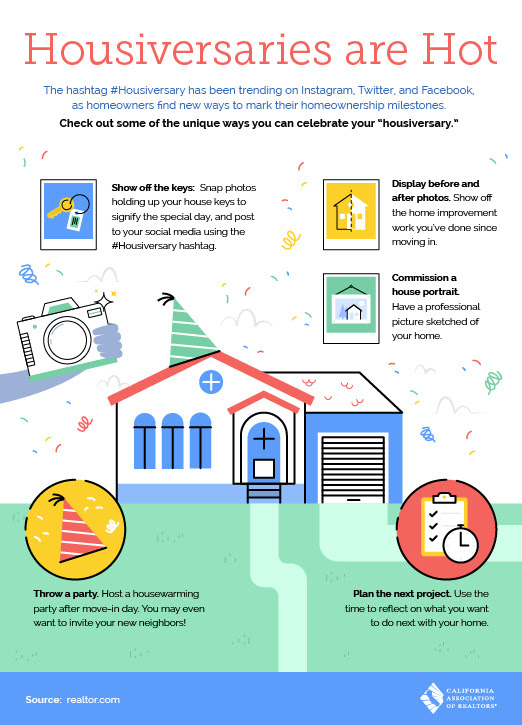
How would you celebrate reaching this milestone?
By Cathy McCabe

How would you celebrate reaching this milestone?
By Cathy McCabe

Big Bear Market Stats as of July 3, 2018
Price breakdown
0-300K- 186 units – 35.8% of inventory
301-500k- 150 units – 28.8% of inventory
501-800k- 96 units- 18.5% of inventory
801k and above – 88 units- 16.9% of inventory
Sold YTD 2018 – 543 units (through 7/3/2018)
0-300k – 305 units- 56.2% of sold units
301-500k- 169 units- 31.1% of sold units
501-800k – 48 units – 8.8% of sold units
801k and above – 21 units 3.9% of sold units
By Cathy McCabe

Big Bear Market Stats as of June 15, 2018
Price breakdown
0-300K- 168 units – 34.8% of inventory
301-500k- 134 units – 27.7% of inventory
501-800k- 100 units- 20.7% of inventory
801k and above – 81 units- 16.8% of inventory
Sold YTD 2018 – 483 units (through 6/15/2018)
0-300k – 262 units- 54.2% of sold units
301-500k- 158 units- 32.7% of sold units
501-800k – 42 units – 8.7% of sold units
801k and above – 21 units 4.3% of sold units
By Cathy McCabe
By Cathy McCabe
By Cathy McCabe
