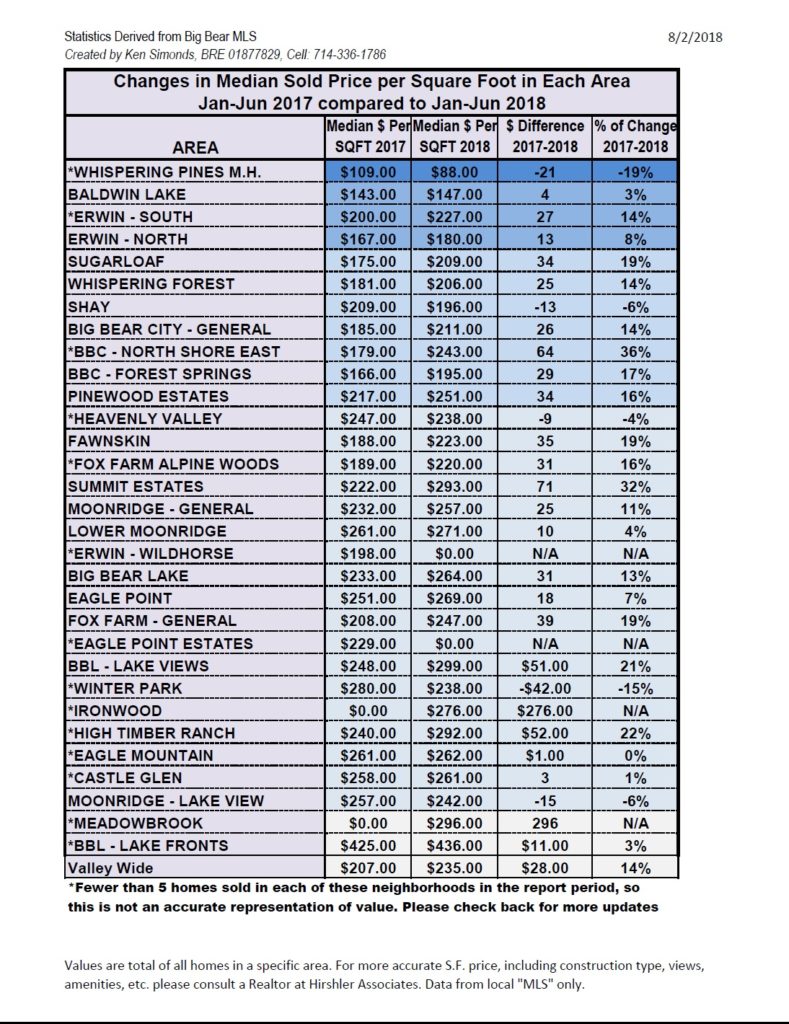
First Half of 2017 over First Half of 2018 Units Sold and Sold Price Per Square Foot with Rate of Change
Housiversaries
How would you celebrate reaching this milestone?
Big Bear Lake Market Stats as of July 3rd, 2018
Big Bear Market Stats as of July 3, 2018
- Total Active Residential Properties: 520 (8% increase from June)
July 2017 reported 548 - Total Residential Properties in Back-Up and Pending: 140 (2% decrease from June)
- Total Residential Properties Sold in June: 100 (9% decrease from May)
*122 properties sold in June 2017, and 107 sold in June 2016. - 110 Sold in May
78 Sold in April
96 Sold in March
70 Sold in February
79 Sold in January
110 Sold in December
147 Sold in November - New Residential Listings in June: 187 (17% decrease from 225 in May)
- 12% of Current Market has been reduced in price in June.
- Properties sold from January 1st 2018 to June 30th 2018: 541 (13% decrease from 619 in January-June 2017)
- Total Sales Volume January 1st 2018 to June 30th 2018: $184,991,749 (4% decrease from $192,172,430 in January-June 2017)
Price breakdown
0-300K- 186 units – 35.8% of inventory
301-500k- 150 units – 28.8% of inventory
501-800k- 96 units- 18.5% of inventory
801k and above – 88 units- 16.9% of inventory
Sold YTD 2018 – 543 units (through 7/3/2018)
0-300k – 305 units- 56.2% of sold units
301-500k- 169 units- 31.1% of sold units
501-800k – 48 units – 8.8% of sold units
801k and above – 21 units 3.9% of sold units
Big Bear Market Statistics as of June 15th, 2017
Photo Courtesy of Cathy McCabe
Big Bear Market Stats as of June 15, 2018
- Total Active Residential Properties: 483 (1% decrease from May 2nd)
June 2017 reported 486 - Total Residential Properties in Back-Up and Pending: 143 (2% increase from May 2nd)
- Total Residential Properties Sold in May: 110 (29% increase from April)
*123 properties sold in May 2017, and 88 sold in May 2016. - 78 Sold in April
96 Sold in March
70 Sold in February
79 Sold in January
110 Sold in December
147 Sold in November
168 Sold in October - New Residential Listings in May: 225 (32% increase from 154 in April)
- 12% of Current Market has been reduced in price in May.
- Properties sold from January 1st 2018 to May 31st 2018: 439 (12% decrease from 497 in January- May 2017)
- Total Sales Volume January 1st 2018 to May 31st 2018: $152,990,404 (1% increase from $151,317,632 in January-May 2017)
Price breakdown
0-300K- 168 units – 34.8% of inventory
301-500k- 134 units – 27.7% of inventory
501-800k- 100 units- 20.7% of inventory
801k and above – 81 units- 16.8% of inventory
Sold YTD 2018 – 483 units (through 6/15/2018)
0-300k – 262 units- 54.2% of sold units
301-500k- 158 units- 32.7% of sold units
501-800k – 42 units – 8.7% of sold units
801k and above – 21 units 4.3% of sold units
What Buyers Want
- « Previous Page
- 1
- …
- 25
- 26
- 27
- 28
- 29
- …
- 51
- Next Page »