Big Bear Market Stats as of January 7, 2019
- Total Active Residential Properties: 430 (9% decrease from December)
January 2018 reported 289 - Total Residential Properties in Back-Up and Pending: 108 (13% decrease from December)
- Total Residential Properties Sold in December: 80 (22% decrease
from November)
*116 properties sold in December 2017, and 109 sold in December 2016. - 102 Sold in November
122 Sold in October
118 Sold in September
122 Sold in August
97 Sold in July
100 Sold in June
110 Sold in May - New Residential Listings in December: 72 (36% decrease from 114 in November)
- 14% of Current Market has been reduced in price in December.
- Properties sold from January 1st 2018 to December 31st 2018: 1195 (21% decrease from 1506 in January-December 2017)
- Total Sales Volume January 1st 2018 to December 31st 2018: $400,534,894 (18% decrease from $489,605,356 in January-December 2017)
Price breakdown as of January 7, 2019
0-300K- 164 units
– 38.1% of inventory
301-500k- 117 units – 27.2% of inventory
501-800k- 67 units- 15.6% of inventory
801k and above – 82 units- 19.1% of inventory
Sold 2018 – 1195 units
0-300k – 667
units- 55.8% of sold units
301-500k- 381 units- 31.9% of sold units
501-800k – 108 units – 9.0% of sold units
801k and above – 39 units 3.3% of sold units

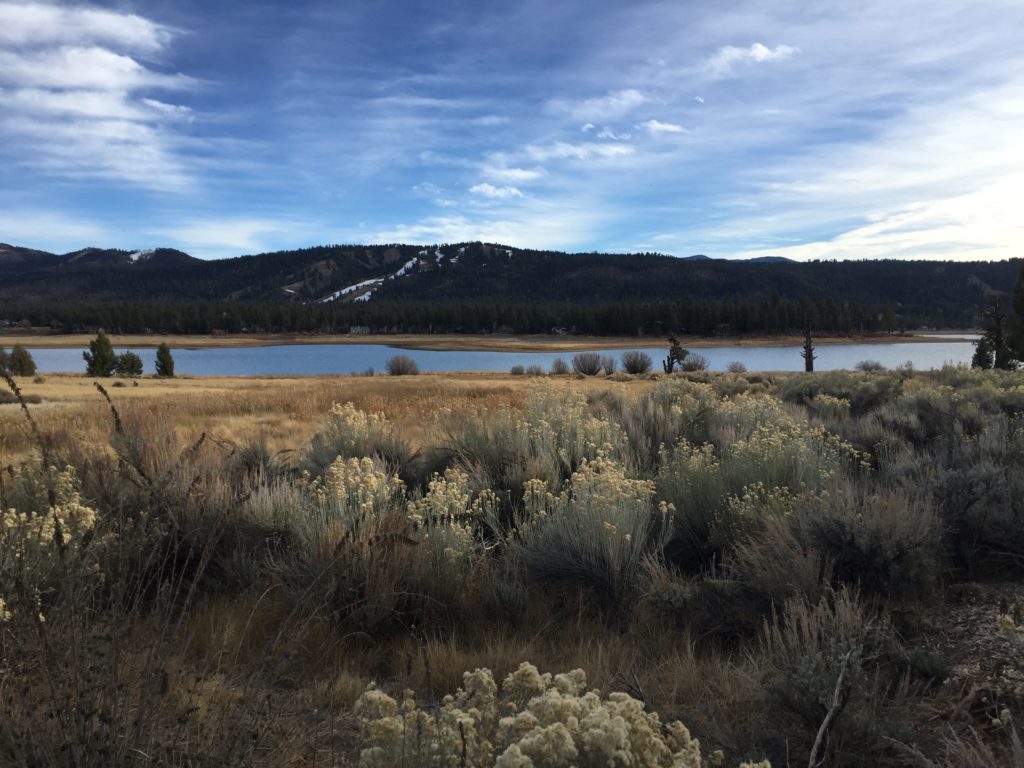 Photo Courtesy of Cathy McCabe
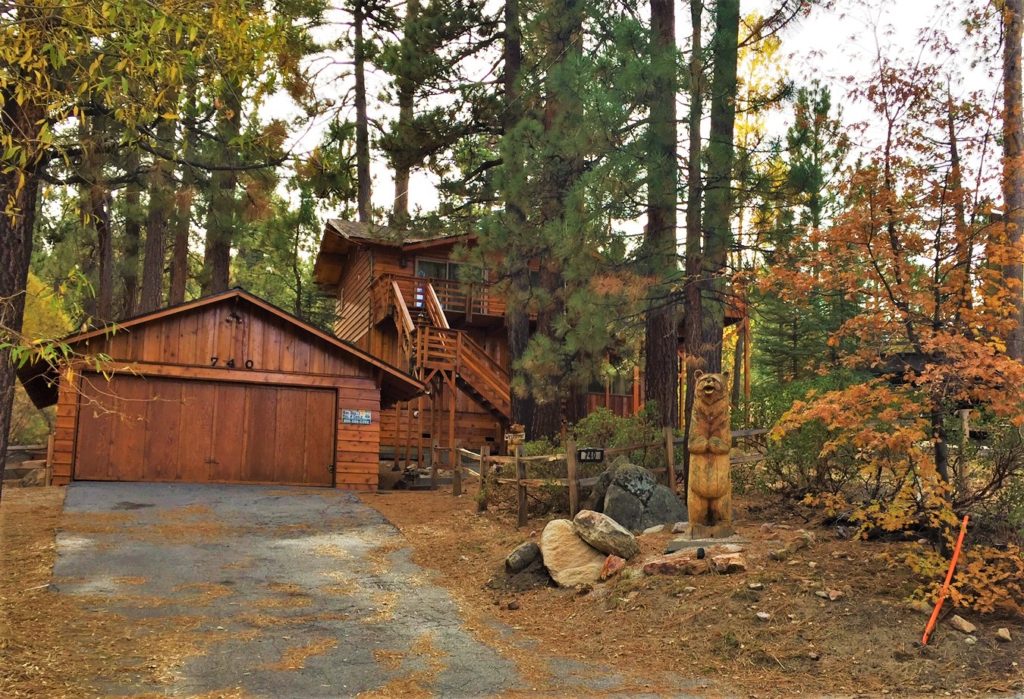 Recently sold Big Bear Lake home