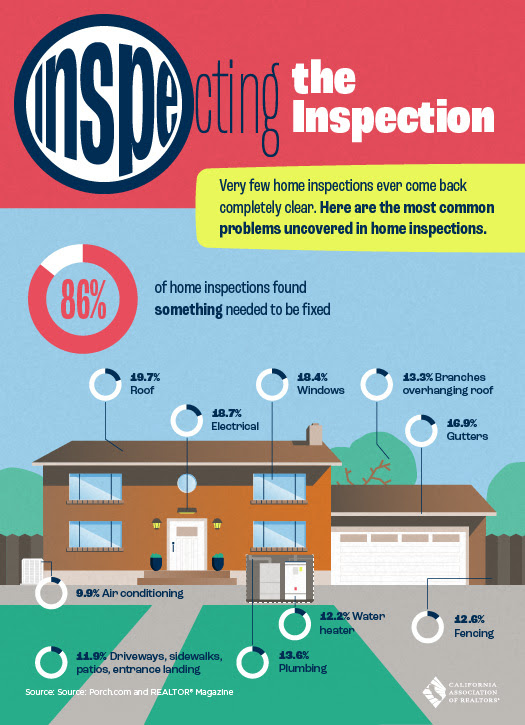
Inspecting the Inspection

By Cathy McCabe

By Cathy McCabe
By Cathy McCabe
By Cathy McCabe
Big Bear Market Stats as of October 1, 2019
Price breakdown as of October 1, 2019
$0-300,000K – 211 units – 36.6% of inventory
$300,001-500k – 161 units – 27.9% of inventory
$500,001-800k – 98 units – 17.0% of inventory
$800,001k plus – 107 units – 18.5% of inventory
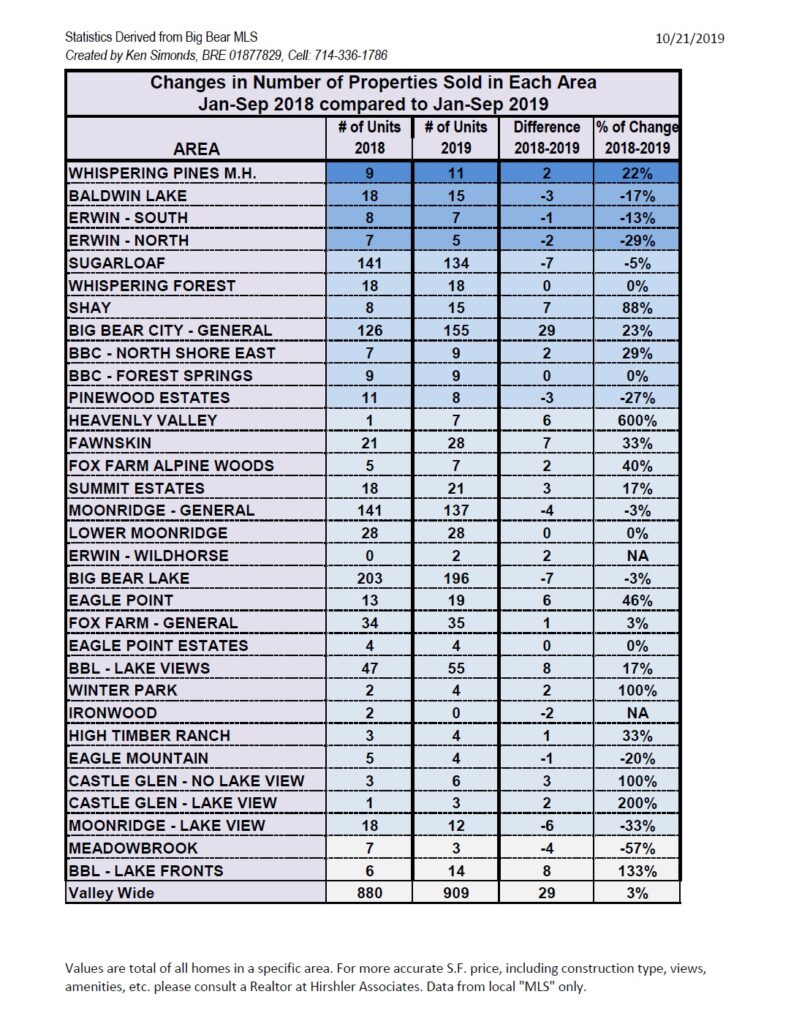
Sold YTD September 2019 – 909 units
$0-300,000k – 482 units – 53% of sold units
$300,001-500k – 298 units – 32.8% of sold units
$500,001-800k – 99 units – 10.9% of sold units
$800,001 plus – 30 units – 3.3% of sold units
By Cathy McCabe
By Cathy McCabe
Big Bear Market Stats as of September 2, 2019
Price breakdown as of September 2, 2019
$0-300,000K – 218 units – 32.3% of inventory
$300,001-500k – 183 units – 33.0% of inventory
$500,001-800k – 111 units – 18.1% of inventory
$800,001k plus – 110 units – 16.6% of inventory
Sold YTD August 2019 – 797 units
$0-300,000k – 423 units – 53.2% of sold units
$300,001-500k – 265 units – 33.2% of sold units
$500,001-800k – 84 units – 10.5% of sold units
$800,001 plus – 25 units – 3.1% of sold units