Big Bear Market Stats as of January 1st, 2021
Big Bear Market Stats as of January 1, 2021
- Total Active Residential Properties: 75 (26% decrease from December)
January 2020 reported 382 - Total Residential Properties in Back-Up and Pending: 171 (17% decrease from December)
- Total Residential Properties Sold in December: 158 (23% decrease from November)
124 properties sold in December 2019, and 81 sold in December 2018. - 204 Sold in November
202 Sold in October
266 Sold in September
233 Sold in August
199 Sold in July
133 Sold in June - New Residential Listings in December: 101 (18% decrease from 123 in November)
- 12% of Current Market was reduced in price in December.
- Properties sold from January 1st 2020 to December 31st 2020: 1812 (40% increase from 1297 from January to December 2019)
- Total Sales Volume January 1st 2020 to December 31st 2020: $837,064,192 (84% increase from $455,295,665 from January to December 2019)
Price breakdown as of January 1, 2021
$0-300,000K – 8 units – 10% of inventory
$300,001-500k – 23 units – 31% of inventory
$500,001-800k – 18 units – 24% of inventory
$800,001k plus – 26 units – 35% of inventory
Sold January-December 2020 – 1812 units
$0-300,000k – 678 units – 38% of sold units
$300,001-500k – 651 units – 36% of sold units
$500,001-800k – 300 units – 16% of sold units
$800,001 plus – 183 units – 10% of sold units
Big Bear Market Stats as of December 1st, 2020
Big Bear Market Stats as of December 1, 2020
- Total Active Residential Properties: 102 (14% decrease from November)
December 2019 reported 458 - Total Residential Properties in Back-Up and Pending: 206 (28% decrease from November)
- Total Residential Properties Sold in November: 204 (1% increase from October)109 properties sold in November 2019, and 103 sold in November 2018.
- 202 Sold in October
266 Sold in September
233 Sold in August
199 Sold in July
133 Sold in June
51 Sold in May - New Residential Listings in November: 123 (25% decrease from 163 in October)
- 21% of Current Market has been reduced in price in November.
- Properties sold from January 1st 2020 to November 30th 2020: 1629 (39% increase from 1173 from January to November 2019)
- Total Sales Volume January 1st 2020 to November 30th 2020: $745,165,467 (80% increase from $413,228,771 from January to November 2019)
Price breakdown as of December 1, 2020
$0-300,000K – 14 units – 14% of inventory
$300,001-500k – 28 units – 27% of inventory
$500,001-800k – 21 units – 21% of inventory
$800,001k plus – 39 units – 38% of inventory
Sold January-November 2020 – 1629 units
$0-300,000k – 616 units – 38% of sold units
$300,001-500k – 590 units – 36% of sold units
$500,001-800k – 268 units – 16% of sold units
$800,001 plus – 157 units – 10% of sold units
Big Bear Market Stats as of November 1st, 2020
Big Bear Market Stats as of November 1, 2020
- Total Active Residential Properties: 119 (20% decrease from October)
November 2019 reported 519 - Total Residential Properties in Back-Up and Pending: 288 (21% decrease from October)
- Total Residential Properties Sold in October: 202 (24% decrease from September)
148 properties sold in October 2019, and 129 sold in October 2018. - 266 Sold in September
233 Sold in August
199 Sold in July
133 Sold in June
51 Sold in May
45 Sold in April - New Residential Listings in September: 163 (25% decrease from 218 in September)
- 13% of Current Market has been reduced in price in October.
- Properties sold from January 1st 2020 to October 31st 2020: 1423 (34% increase from 1064 from January to September 2019)
- Total Sales Volume January 1st 2020 to October 31st 2020: $637,466,069 (70% increase from $374,431,000 from January to September 2019)
Price breakdown as of November 1, 2020
$0-300,000K – 25 units – 21% of inventory
$300,001-500k – 32 units – 27% of inventory
$500,001-800k – 23 units – 19% of inventory
$800,001k plus – 39 units – 33% of inventory
Sold January-September 2020 – 1423 units
$0-300,000k – 551 units – 39% of sold units
$300,001-500k – 514 units – 36% of sold units
$500,001-800k – 231 units – 16% of sold units
$800,001 plus – 127 units – 9% of sold units
Active Properties in Big Bear Each Month by Year
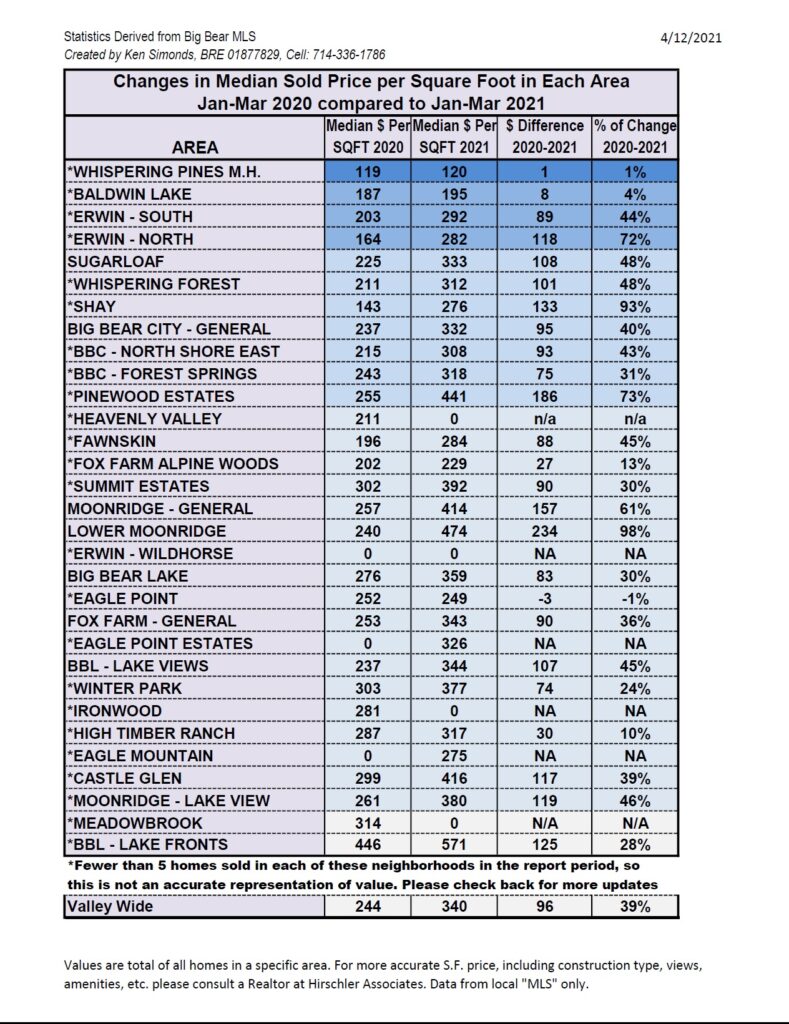
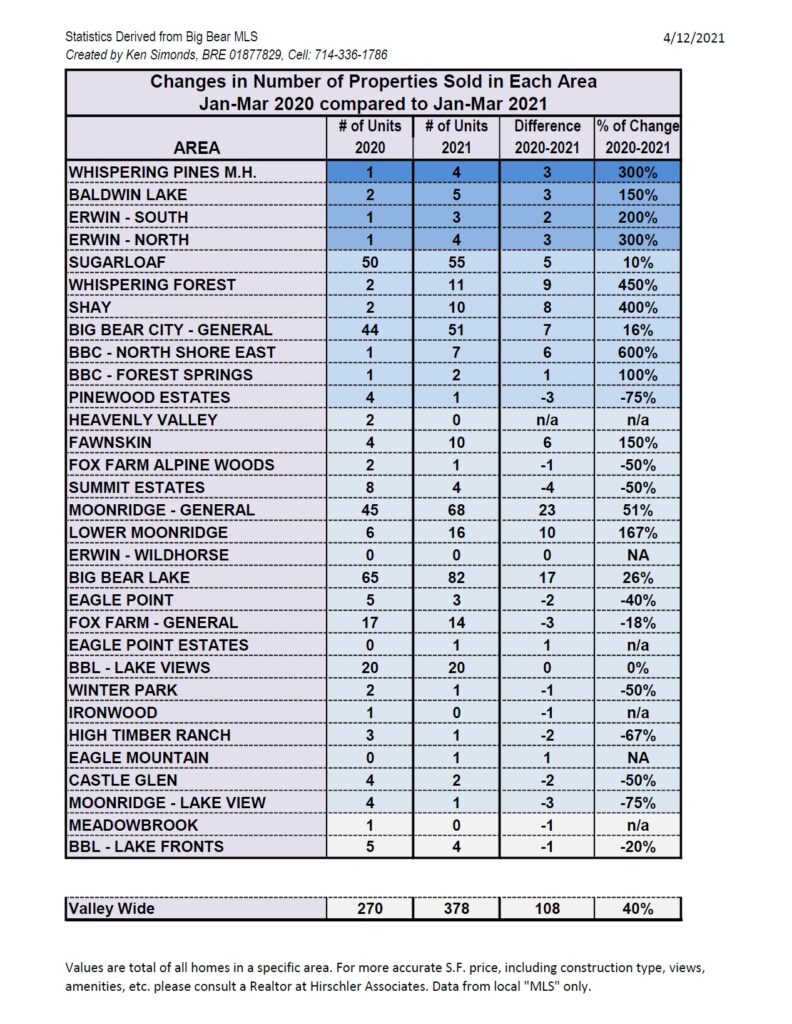
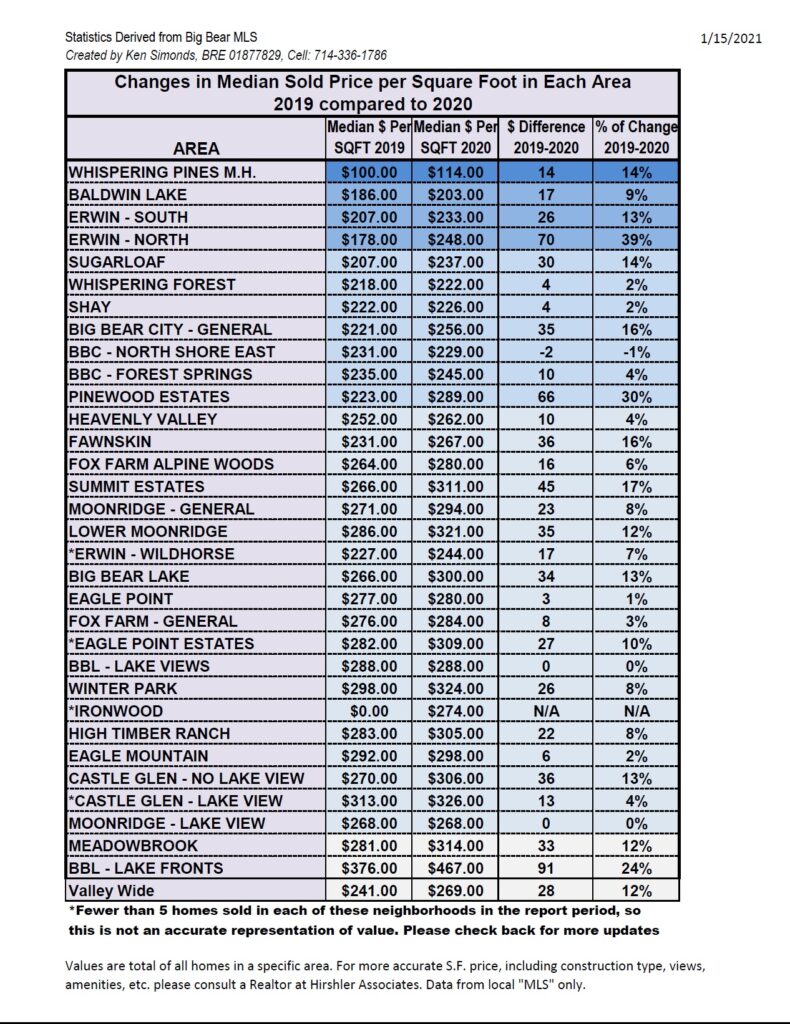
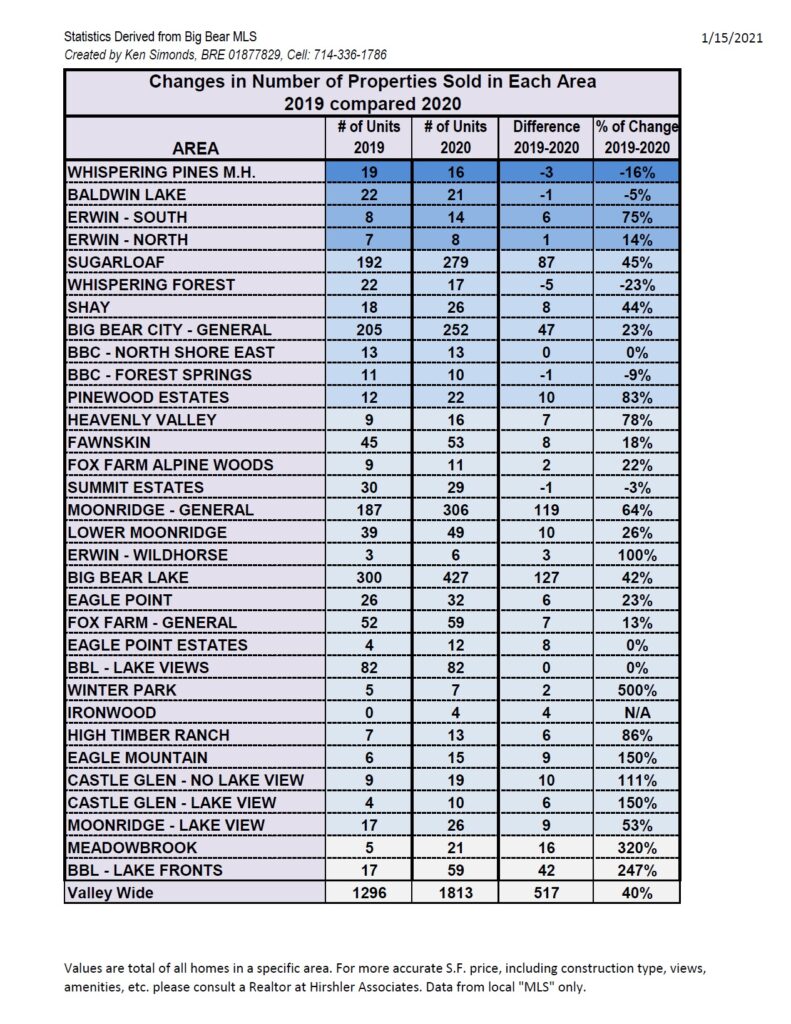
Changes in Median Sold Price per SqFt and Units Sold in Each Neighborhood
- « Previous Page
- 1
- …
- 12
- 13
- 14
- 15
- 16
- …
- 51
- Next Page »