
Market Statistics for Big Bear As Of April 2, 2019

Big Bear Market Stats as of April 2, 2019
- Total Active Residential Properties: 372 (4% increase from March)
April 2018 reported 345 - Total Residential Properties in Back-Up and Pending: 126 (12% increase from March)
- Total Residential Properties Sold in March: 83 (9% increase from February)
*100 properties sold in March 2018, and 111 sold in March 2017. - 77 Sold in February
81 Sold in January
80 Sold in December
102 Sold in November
122 Sold in October
118 Sold in September
122 Sold in August - New Residential Listings in February: 146 (101% increase from 71 in February)
- 11% of Current Market has been reduced in price in March.
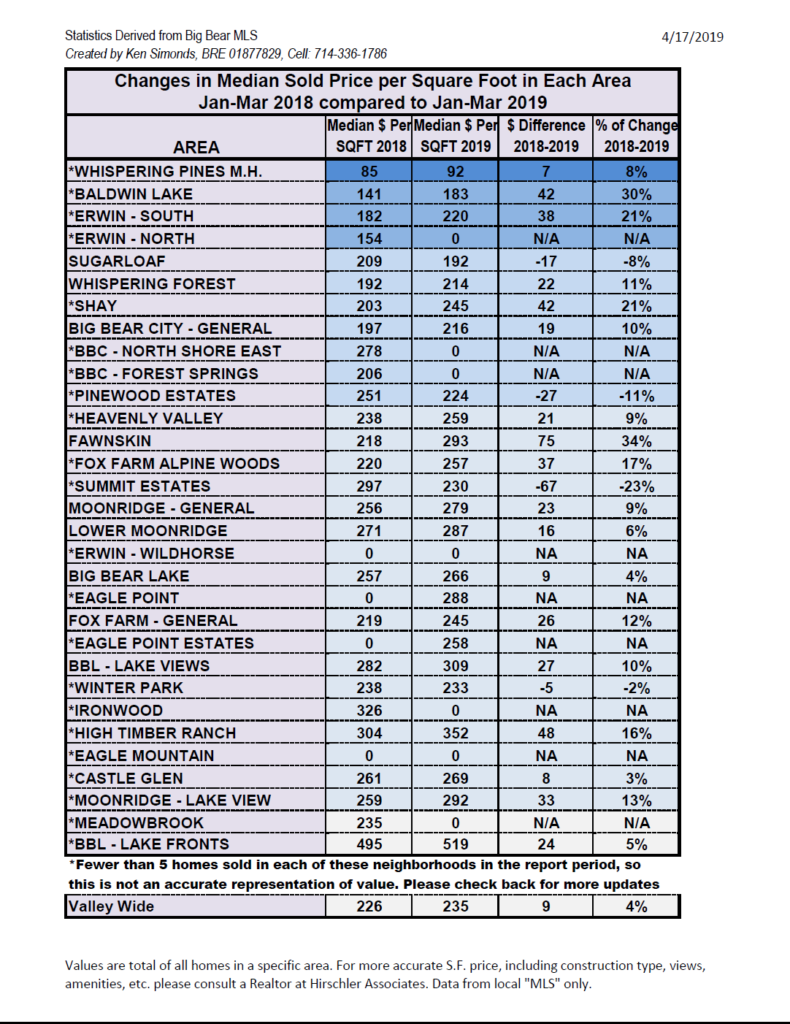
- Properties sold from January 1st 2019 to March 31st 2019: 245 (3% decrease from 252 in January-March 2018)
- Total Sales Volume January 1st 2019 to March 31st 2019: $88,977,822 (3% increase from $86,570,995 in January-March 2018)
Price breakdown as of April 2, 2019
$0-300,000K – 123
units – 33.2% of inventory
$300,001-500k – 118 units – 31.7% of inventory
$500,001-800k – 59 units– 15.9% of inventory
$800,001k plus – 71 units– 19.2% of inventory
Sold March 2019 – 83 units
$0-300,000k – 40
units– 48.2% of sold units
$300,001-500k – 28 units– 33.7% of sold units
$500,001-800k – 14 units – 16.9% of sold units
$800,001 plus – 1 units– 1.2% of sold units
Share this:

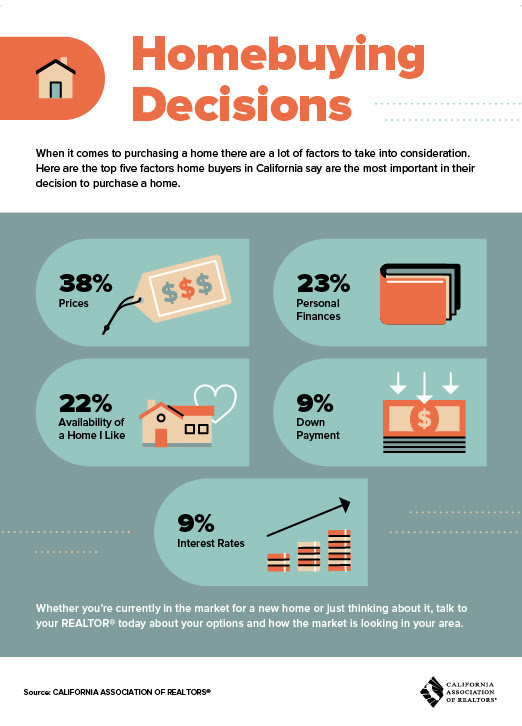
Homebuying Decisions
Share this:

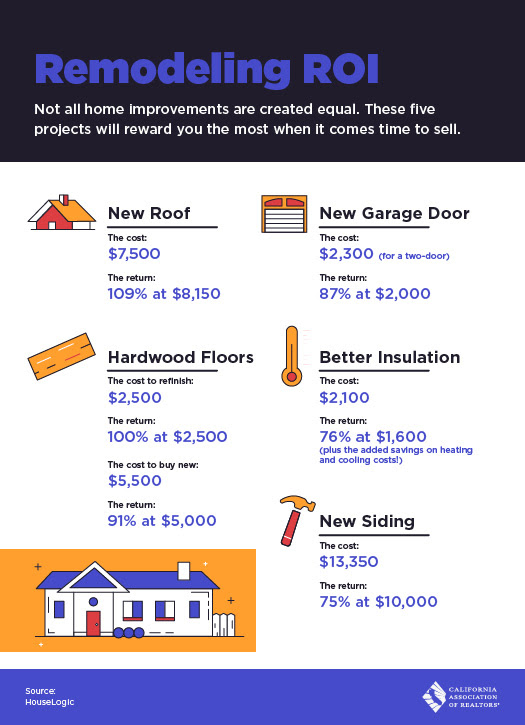
Remodeling ROI
Share this:

Big Bear Market Statistics as of March 1st, 2019
Big Bear Market Stats as of March 1, 2019
- Total Active Residential Properties: 357 (4% decrease from February)
March 2018 reported 292 - Total Residential Properties in Back-Up and Pending: 113 (12% decrease from February)
- Total Residential Properties Sold in February: 76 (6% decrease
from January)
*70 properties sold in February 2018, and 76 sold in February 2017. - 81 Sold in January
80 Sold in December
102 Sold in November
122 Sold in October
118 Sold in September
122 Sold in August
97 Sold in July - New Residential Listings in February: 71 (41% decrease from 120 in January)
- 13% of Current Market has been reduced in price in February.
- Properties sold from January 1st 2019 to February 28th 2019: 160 (5% increase from 152 in January-February 2018)
- Total Sales Volume January 1st 2019 to February 28th 2019: $57,273,500 (10% increase from $51,371,345 in January 2018)
Price breakdown as of March 1, 2019
$0-300,000K – 132
units – 37% of inventory
$300,001-500k – 102 units – 28.6% of inventory
$500,001-800k – 48 units– 13.4% of inventory
$800,001k plus – 75 units– 21% of inventory
Sold February 2019 – 76 units
$0-300,000k – 41
units– 53.9% of sold units
$300,001-500k – 17 units– 22.4% of sold units
$500,001-800k – 13 units – 17.1% of sold units
$800,001k plus – 5 units– 6.6% of sold units
Share this:

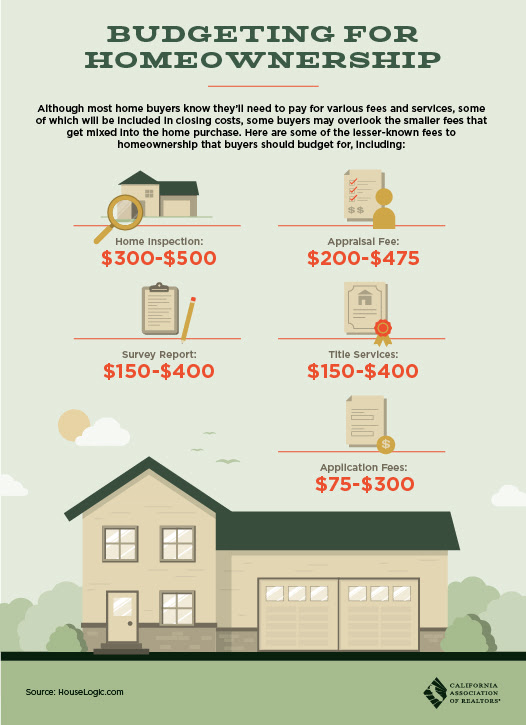
Budgeting for Homeownership
Share this:

- « Previous Page
- 1
- …
- 18
- 19
- 20
- 21
- 22
- …
- 49
- Next Page »