![]()

Housiversaries


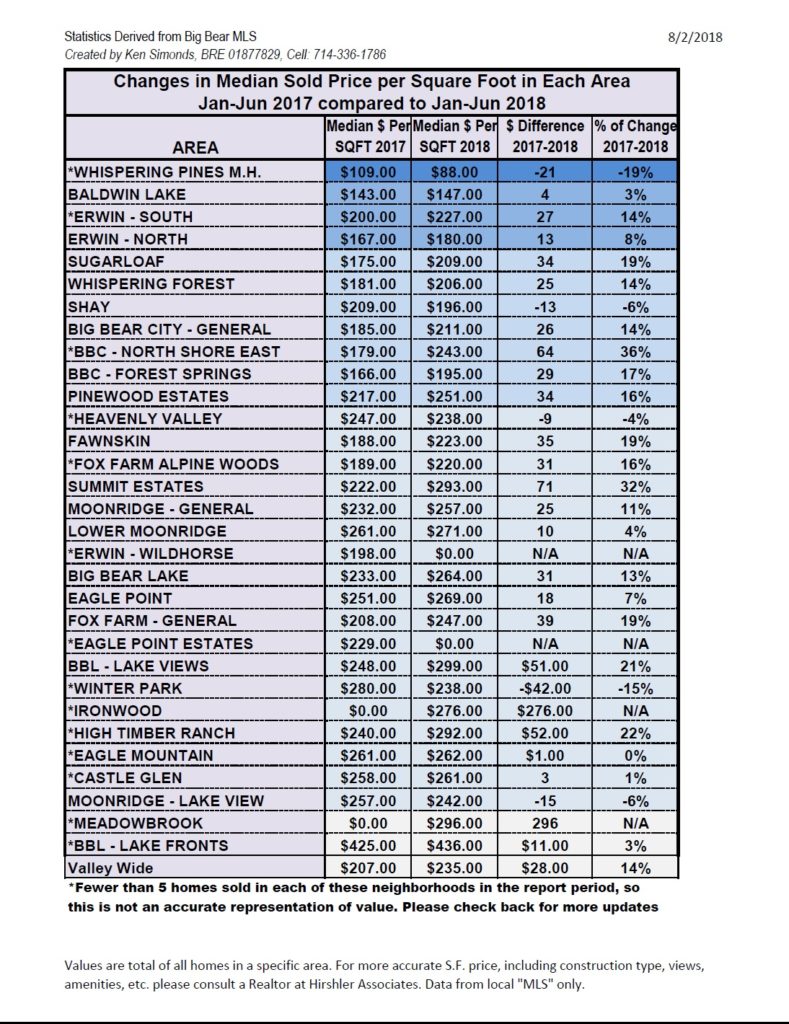
Big Bear Lake Market Stats as of July 3rd, 2018

Big Bear Market Stats as of July 3, 2018
- Total Active Residential Properties: 520 (8% increase from June)
July 2017 reported 548 - Total Residential Properties in Back-Up and Pending: 140 (2% decrease from June)
- Total Residential Properties Sold in June: 100 (9% decrease from May)
*122 properties sold in June 2017, and 107 sold in June 2016. - 110 Sold in May
78 Sold in April
96 Sold in March
70 Sold in February
79 Sold in January
110 Sold in December
147 Sold in November - New Residential Listings in June: 187 (17% decrease from 225 in May)
- 12% of Current Market has been reduced in price in June.
- Properties sold from January 1st 2018 to June 30th 2018: 541 (13% decrease from 619 in January-June 2017)
- Total Sales Volume January 1st 2018 to June 30th 2018: $184,991,749 (4% decrease from $192,172,430 in January-June 2017)
Price breakdown
0-300K- 186 units – 35.8% of inventory
301-500k- 150 units – 28.8% of inventory
501-800k- 96 units- 18.5% of inventory
801k and above – 88 units- 16.9% of inventory
Sold YTD 2018 – 543 units (through 7/3/2018)
0-300k – 305 units- 56.2% of sold units
301-500k- 169 units- 31.1% of sold units
501-800k – 48 units – 8.8% of sold units
801k and above – 21 units 3.9% of sold units
Share this:

Big Bear Market Statistics as of June 15th, 2017

Photo Courtesy of Cathy McCabe
Big Bear Market Stats as of June 15, 2018
- Total Active Residential Properties: 483 (1% decrease from May 2nd)
June 2017 reported 486 - Total Residential Properties in Back-Up and Pending: 143 (2% increase from May 2nd)
- Total Residential Properties Sold in May: 110 (29% increase from April)
*123 properties sold in May 2017, and 88 sold in May 2016. - 78 Sold in April
96 Sold in March
70 Sold in February
79 Sold in January
110 Sold in December
147 Sold in November
168 Sold in October - New Residential Listings in May: 225 (32% increase from 154 in April)
- 12% of Current Market has been reduced in price in May.
- Properties sold from January 1st 2018 to May 31st 2018: 439 (12% decrease from 497 in January- May 2017)
- Total Sales Volume January 1st 2018 to May 31st 2018: $152,990,404 (1% increase from $151,317,632 in January-May 2017)
Price breakdown
0-300K- 168 units – 34.8% of inventory
301-500k- 134 units – 27.7% of inventory
501-800k- 100 units- 20.7% of inventory
801k and above – 81 units- 16.8% of inventory
Sold YTD 2018 – 483 units (through 6/15/2018)
0-300k – 262 units- 54.2% of sold units
301-500k- 158 units- 32.7% of sold units
501-800k – 42 units – 8.7% of sold units
801k and above – 21 units 4.3% of sold units
Share this:

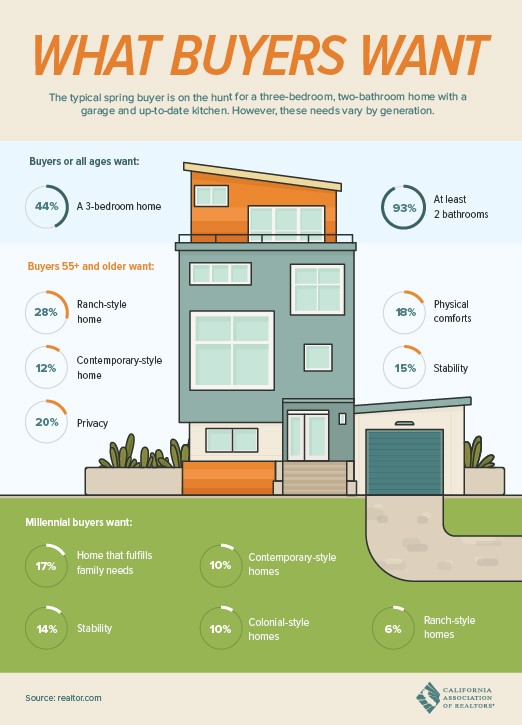
What Buyers Want
Share this:

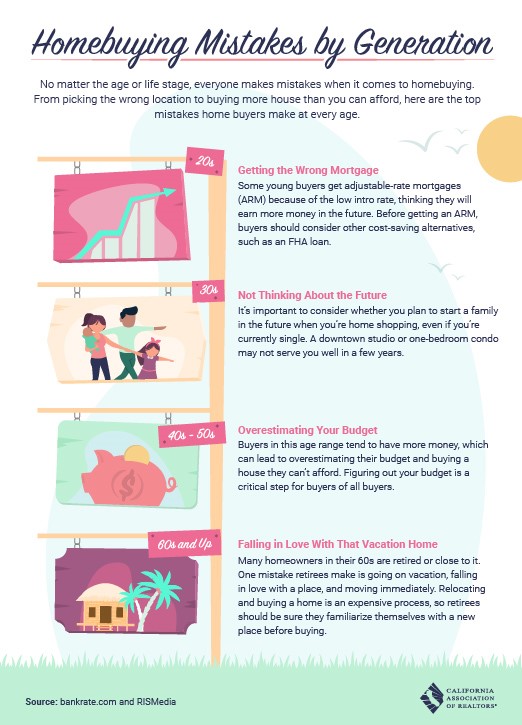
Homebuying Mistakes by Generation
Share this:

- « Previous Page
- 1
- …
- 23
- 24
- 25
- 26
- 27
- …
- 47
- Next Page »