
Big Bear Market Stats as of April 1, 2024

Big Bear Market Stats as of April 1st,2024
- Total Active Residential Properties: 268 (4% increase from March) April 2023 reported 197
- Total Residential Properties in Back-Up and Pending: 78 (15% increase from March)
- Total Residential Properties Sold in March: 65 (18% increase from February)
68 properties sold in March 2023, and 132 sold in March 2022. - 55 sold in February
50 sold in January
68 Sold in December
54 Sold in November
63 Sold in October
71 Sold in September
81 Sold in August - New Residential Listings in March: 104 (22% increase from 85 in February)
- 19% of Current Market was reduced in price in March.
- Properties sold from January 1st 2024 to March 31st 2024: 170 (3% decrease from 176 in January-March 2023)
- Total Sales Volume January 1st 2024 to March 31st 2024: $102,031,487 (7% decrease from $109,574,842 in January-March 2023)
Price breakdown as of April 1, 2024
$0-300,000K – 17 units – 6% of inventory
$300,001-500k – 87 units – 33% of inventory
$500,001-800k – 99 units – 37% of inventory
$800,001k plus – 65 units – 24% of inventory
Sold Jan-Mar 2024– 170 units
$0-300,000k – 17 units – 10% of sold units
$300,001-500k – 60 units – 35% of sold units
$500,001-800k – 65 units – 38% of sold units
$800,001 plus – 28 units – 17% of sold units
Share this:

Big Bear Market Statistics as of March 1st, 2024

Big Bear Market Stats as of March 1st,2024
- Total Active Residential Properties: 251 (2% increase from February) March 2023 reported 182
- Total Residential Properties in Back-Up and Pending: 68 (5% decrease from February)
- Total Residential Properties Sold in January: 55 (10% increase from January)
54 properties sold in February 2023, and 80 sold in February 2022. - 50 sold in January
68 Sold in December
54 Sold in November
63 Sold in October
71 Sold in September
81 Sold in August
74 Sold in July - New Residential Listings in February: 85 (49% increase from 57 in January)
- 10% of Current Market was reduced in price in February.
- Properties sold from January 1st 2024 to February 29th 2024: 105 (2% decrease from 108 in January-February 2023)
- Total Sales Volume January 1st 2024 to February 29th 2024: $60,055,747 (8% decrease from $65,162,942 in January-February 2023)
Price breakdown as of March 1, 2024
$0-300,000K – 13 units – 5% of inventory
$300,001-500k – 78 units – 31% of inventory
$500,001-800k – 90 units – 36% of inventory
$800,001k plus – 70 units – 28% of inventory
Sold Jan-Feb 2024– 105 units
$0-300,000k – 11 units – 11% of sold units
$300,001-500k – 38 units – 36% of sold units
$500,001-800k – 41 units – 39% of sold units
$800,001 plus – 15 units – 14% of sold units
Share this:

Big Bear Market Statistics as of February 1st, 2024

Big Bear Market Stats as of February 1st, 2024
Total Active Residential Properties: 251 (9% decrease from January) February 2023
reported 195
Total Residential Properties in Back-Up and Pending: 72 (33% increase from January)
Total Residential Properties Sold in January: 50 (26% decrease from December)
54 properties sold in January 2023, and 97 sold in January 2022.
68 Sold in December
54 Sold in November
63 Sold in October
71 Sold in September
81 Sold in August
74 Sold in July
New Residential Listings in January: 57 (10% increase from 52 in December)
14% of Current Market was reduced in price in January.
Properties sold from January 1st 2024 to January 31st 2024: 50 (7% decrease from
54 in January 2023)
Total Sales Volume January 1st 2024 to January 31st 2024: $26,150,862 (18%
decrease from $31,816,142 in January 2023)
Price breakdown as of February 1, 2024
$0-300,000K – 13 units – 5% of inventory
$300,001-500k – 78 units – 31% of inventory
$500,001-800k – 90 units – 36% of inventory
$800,001k plus – 70 units – 28% of inventory
Sold Jan 2024– 50 units
$0-300,000k – 7 units – 14% of sold units
$300,001-500k – 19 units – 38% of sold units
$500,001-800k – 19 units – 38% of sold units
$800,001 plus – 5 units – 10% of sold units
Share this:

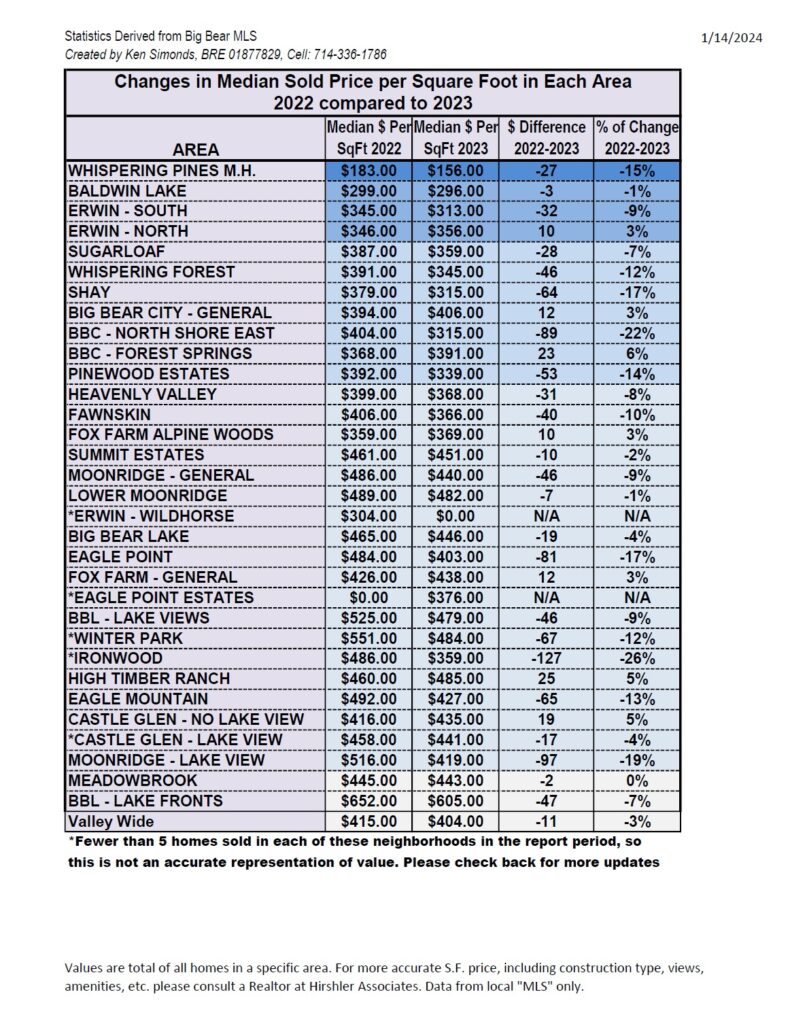
Changes in Median Sold Price per Square Foot and Units Sold in Each Area Jan-Dec 2022 compared to Jan-Dec 2023


Big Bear Market Statistics as of January 1st, 2024

Big Bear Market Stats as of January 1st, 2024
- Total Active Residential Properties: 276 (15% decrease from December) January 2023 reported 217
- Total Residential Properties in Back-Up and Pending: 54 (28% decrease from December)
- Total Residential Properties Sold in December: 68 (21% increase from November)
53 properties sold in December 2022, and 106 sold in December 2021. - 54 Sold in November
63 Sold in October
71 Sold in September
81 Sold in August
74 Sold in July
64 Sold in June - New Residential Listings in December: 52 (19% decrease from 64 in November)
- 17% of Current Market was reduced in price in December.
- Properties sold from January 1st 2023 to December 31st 2023: 784 (30% decrease from 1128 in January-December 2022)
- Total Sales Volume January 1st 2023 to December 31st 2023: $489,786,852 (31% decrease from $713,151,781 in January-December 2022)
Price breakdown as of January 1, 2024
$0-300,000K – 16 units – 6% of inventory
$300,001-500k – 88 units – 32% of inventory
$500,001-800k – 94 units – 34% of inventory
$800,001k plus – 78 units – 28% of inventory
Sold Jan-Dec 2023– 784 units
$0-300,000k – 69 units – 9% of sold units
$300,001-500k – 331 units – 42% of sold units
$500,001-800k – 247 units – 32% of sold units
$800,001 plus – 137 units – 17% of sold units
Share this:

- 1
- 2
- 3
- …
- 47
- Next Page »